Analysis Workflow and Content Interpretation
Immunoglobulin repertoire analysis typically includes the following core steps, each revealing different aspects of the immune response:
Cell Quality Control
Cell quality control is the cornerstone of ensuring accurate and reliable single-cell immunoglobulin repertoire analysis. This step aims to filter out low-quality cells and sequencing data through a series of strict quality assessment metrics, providing high-quality input for subsequent bioinformatics analysis. To ensure the reliability of the analysis results, we focus on the following core quality control metrics:
- Library Quality: Qualified TCR/BCR libraries should show specific peaks within the 250-1500bp range when tested with Agilent 4200 TapeStation, with a library concentration of at least 1ng/μL.
- Sequencing Depth: The recommended average number of sequencing reads per cell (Mean Read Pairs per Cell) is not less than 5,000 to ensure sufficient information for accurate Contig assembly.
- Data Quality:
- Estimated Number of Cells: Evaluates the number of captured cells.
- Valid Barcodes: The proportion of reads with valid cell barcodes, typically should be > 80%.
- Q30 Bases in Barcode/UMI: The proportion of bases with sequencing quality values ≥ Q30 in barcode and UMI sequences, which is a key indicator of sequencing accuracy, typically required to be > 90%.
- Reads Mapped to Any V(D)J Gene: The proportion of reads mapped to V(D)J reference genes, reflecting the specificity and efficiency of V(D)J enrichment.
- Number of Cells With
productiveV-J Spanning Pair: The number of cells identified with complete and functional V-J paired chains, which is the basis for subsequent clonotype analysis.
Immunoglobulin Repertoire Assembly and Clonotype Definition
The goal of this step is to convert raw sequencing data into biologically meaningful immune cell clones, with the core process including TCR/BCR structure recognition, sequence assembly annotation, and final clonotype definition.
Introduction to TCR/BCR Structure
The structure of TCR and BCR determines their antigen recognition specificity. Their variable regions are formed by the rearrangement of V, D, and J gene segments, with CDR3 (Complementarity Determining Region 3) being the most variable region that directly determines antigen binding specificity.
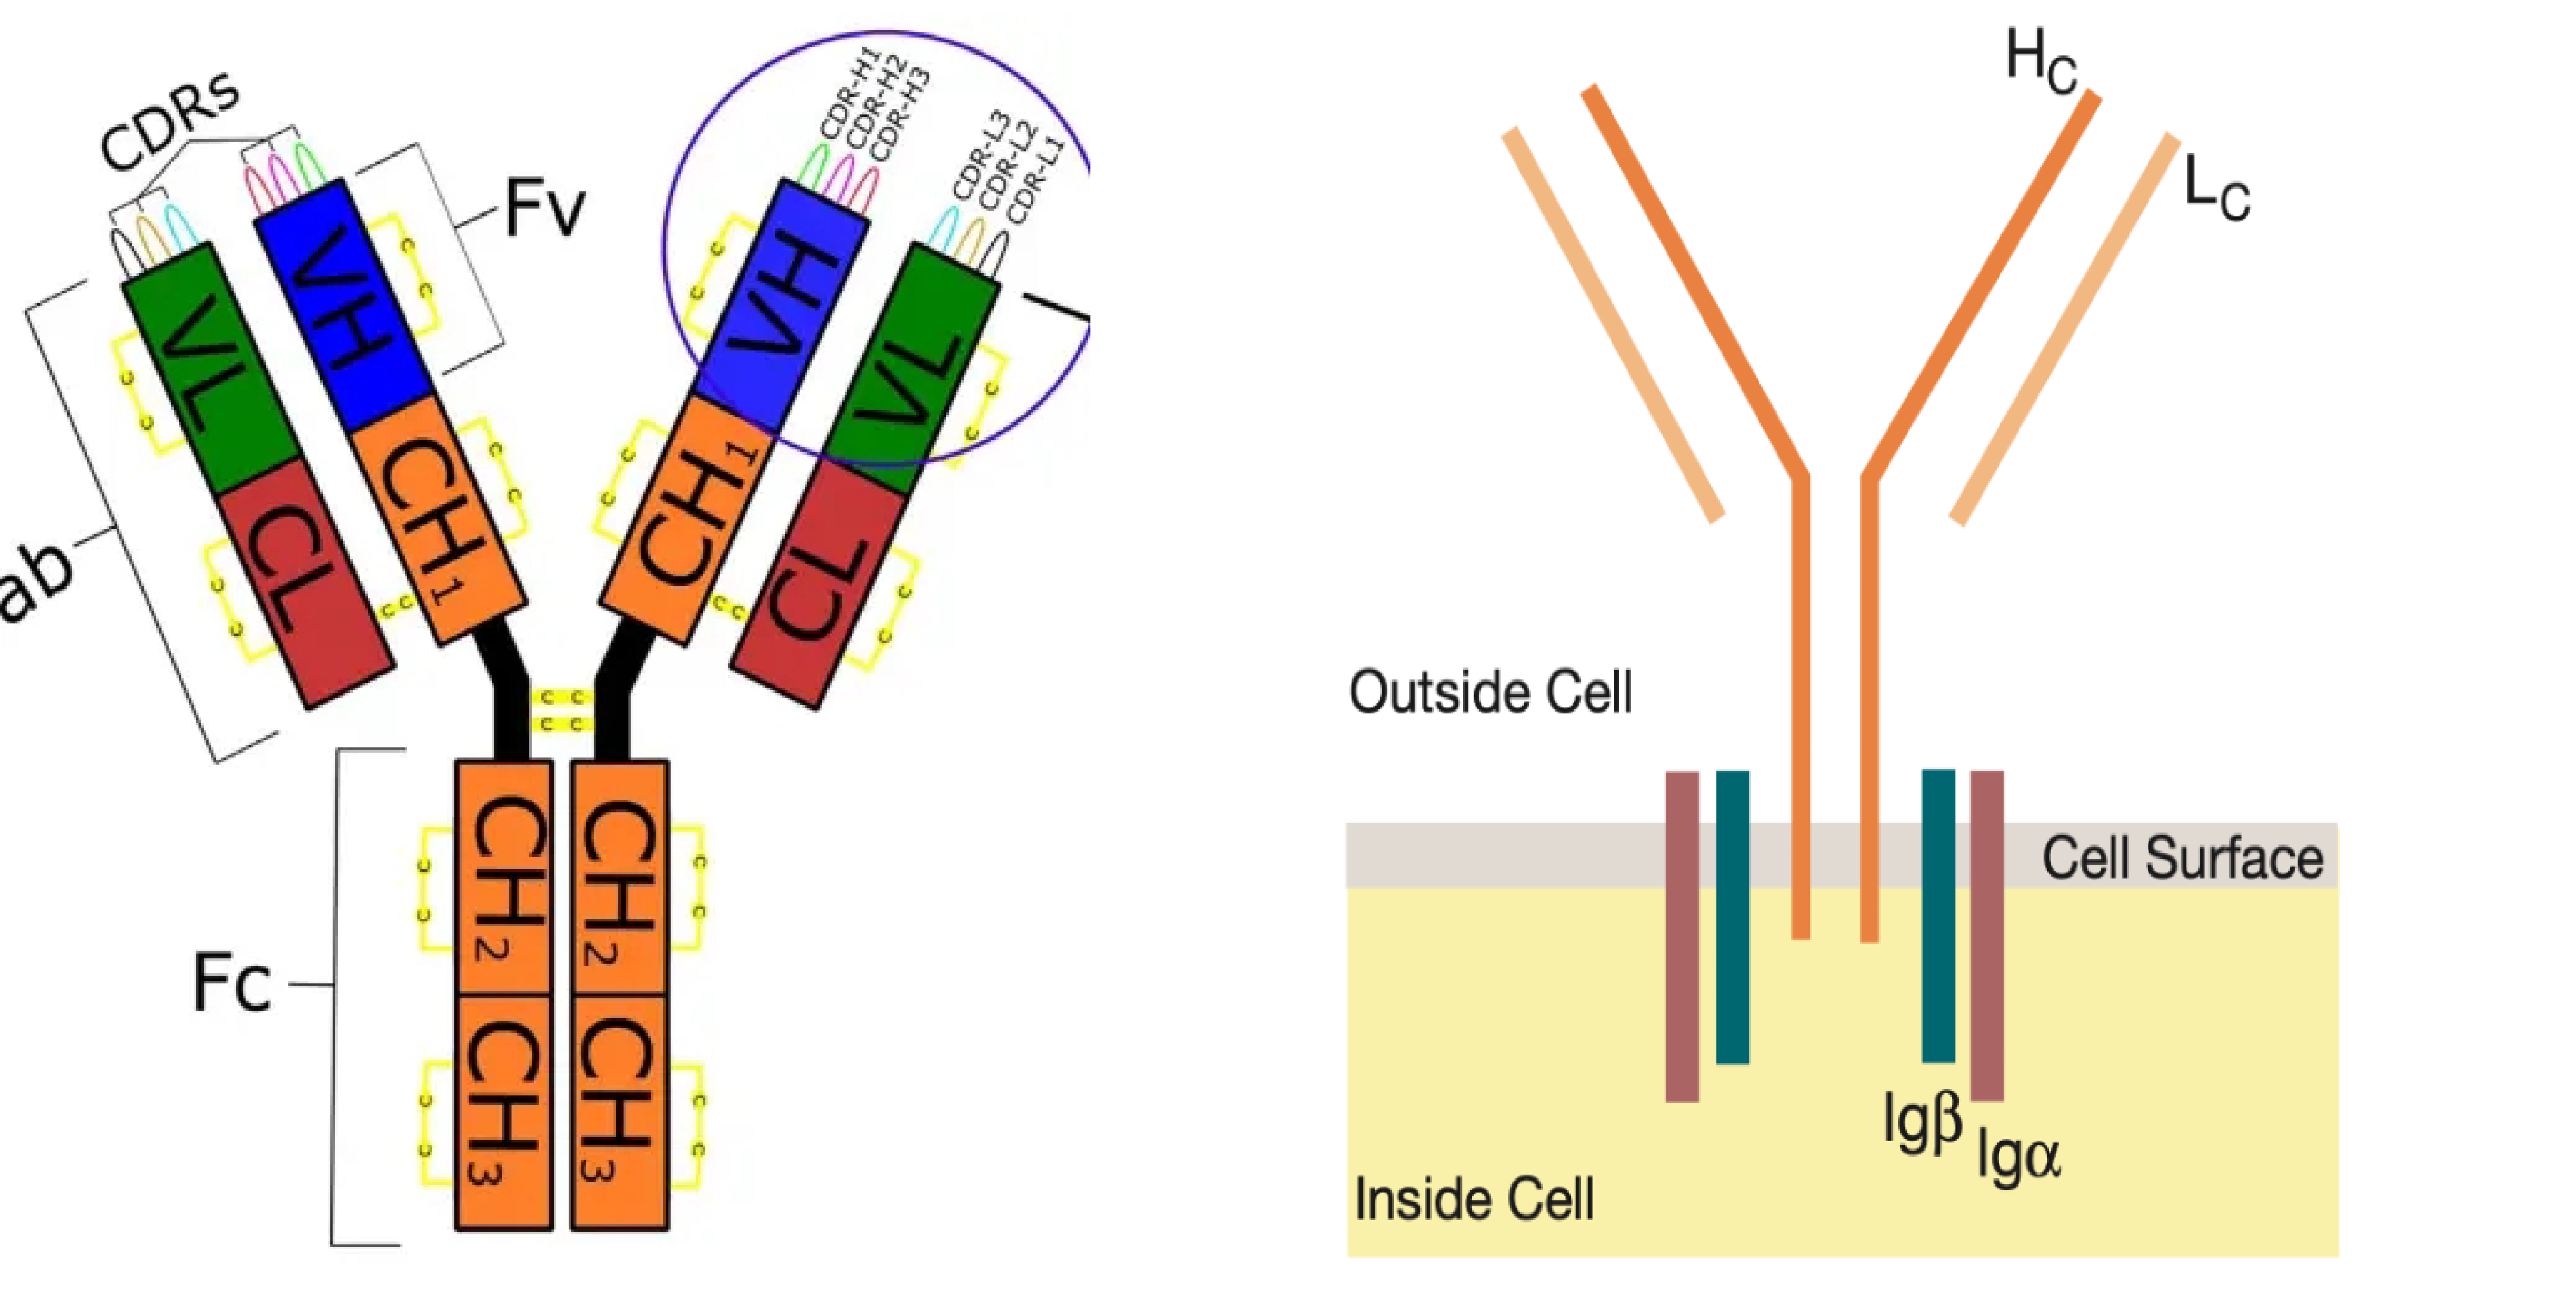
BCR is composed of two heavy chains (H) and two light chains (L), with its antigen-binding capability determined by the V region.
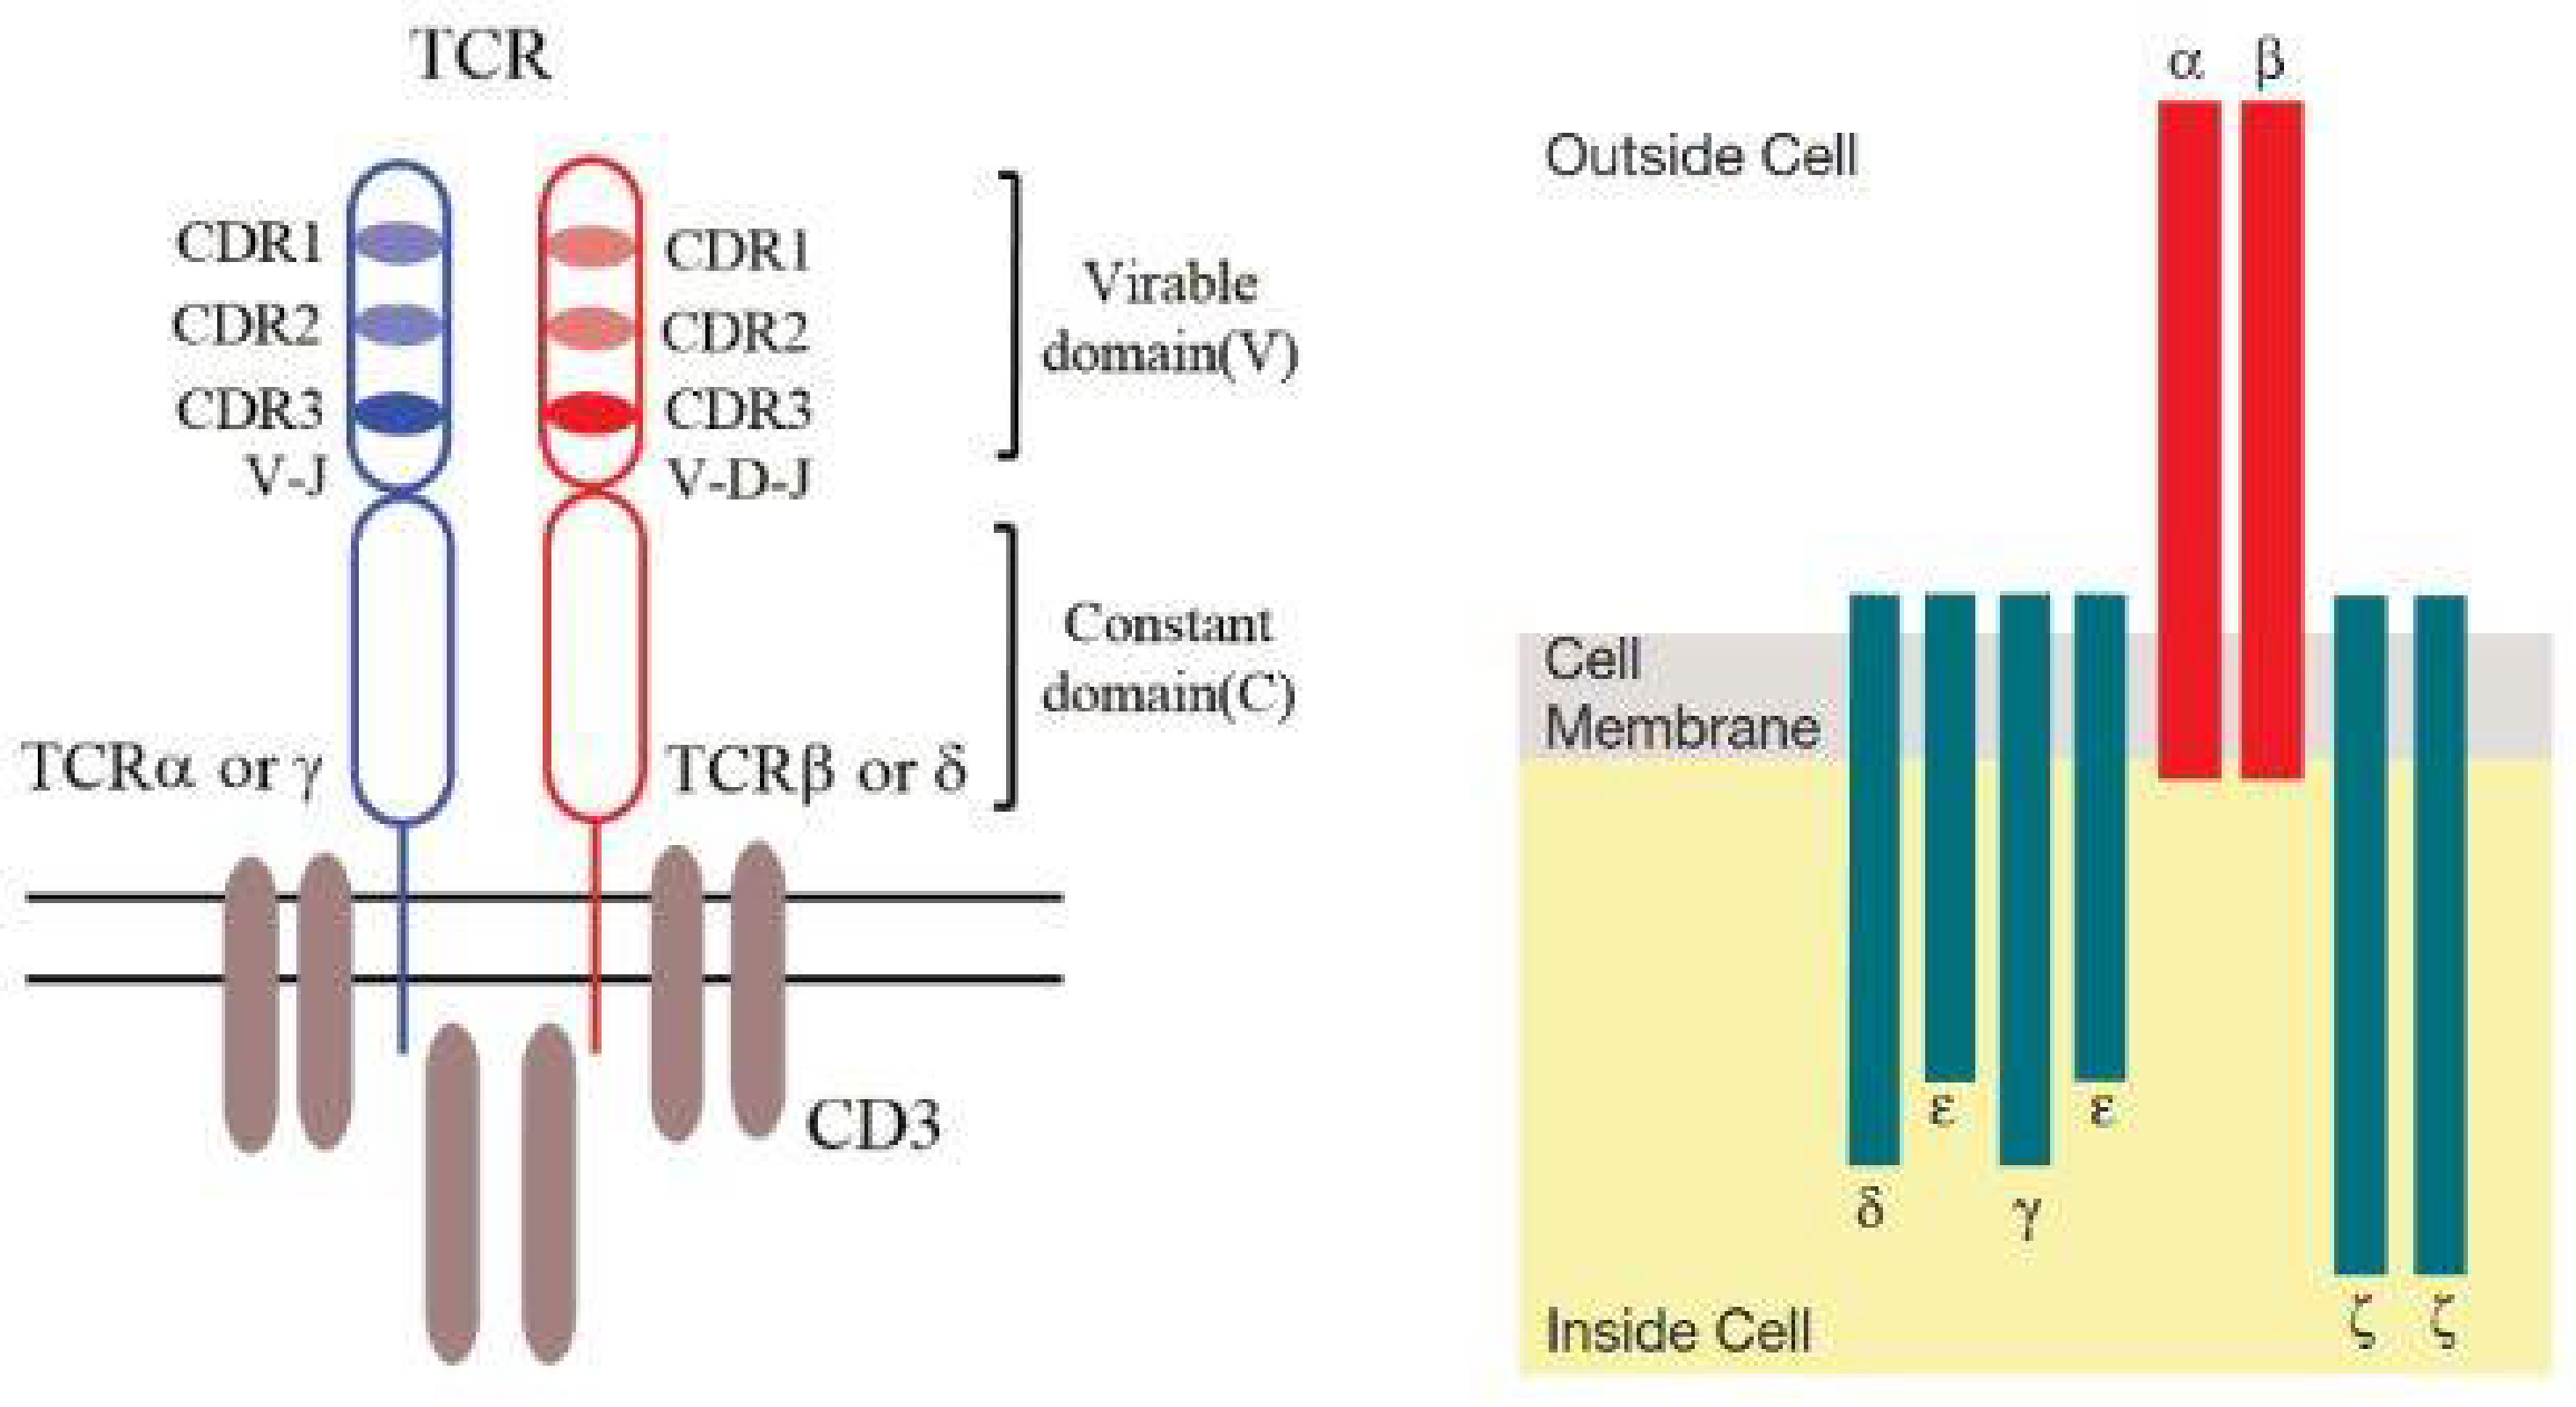
TCR is mainly a heterodimer composed of αβ chains or γδ chains, recognizing and binding antigen peptides presented by MHC molecules through the variable region.
Sequence Assembly and VDJ Annotation
SeekSoul® Tools employs the following workflow for sequence assembly and annotation:
- Sequence Extraction and Downsampling: The TRUST4 tool is used to extract reads that may contain TCR/BCR sequences from the raw data. For efficiency balancing, cells with more than 80,000 reads are downsampled.
- UMI Correction and Sequence Assembly: Before assembly,
umitoolsis used to correct UMIs to eliminate errors introduced by sequencing and PCR amplification. Subsequently, based on the corrected UMIs and reads,TRUST4assembles the V(D)J sequences of each cell to generate Contigs. - VDJ Gene Annotation: The
annotatormodule ofTRUST4is used to annotate the assembled Contigs, determining the usage of V/D/J/C genes and the precise position and sequence of CDR3.- Primary Chain Selection: Within a cell, if there are multiple annotation results for a chain (such as TRB), the software selects the Contig with the highest UMI count as the
primary_chainfor that chain.
- Primary Chain Selection: Within a cell, if there are multiple annotation results for a chain (such as TRB), the software selects the Contig with the highest UMI count as the
Clonotype Definition
A Clonotype is a group of cells with identical or highly similar immune receptors. SeekSoul® Tools defines clonotypes through the following refined steps:
- High-Quality Contig Filtering: First, cells are filtered to require a total UMI count supporting the Contig of at least 3.
- CDR3 Sequence Similarity-Based Clustering: The dandelion tool is used to define clones based on the similarity of CDR3 amino acid sequences. Similarity thresholds vary by receptor type:
- BCR set to 85%
- TCR set to 100%
- Optimization of Single-Chain Clonotypes: To optimize single-chain clonotypes (such as those containing only TRB chains), the software automatically matches and merges them with double-chain clonotypes that have the same VJ genes and CDR3 sequences to ensure the accuracy of clonotype definitions.
TIP
The quality of Contig assembly and the accuracy of Clonotype definition directly determine the reliability of all subsequent analyses. In the analysis report, focus should be placed on the number of high-quality (high_confidence, full_length, productive) Contigs and the final number of identified clonotypes.
Cell Mapping
The goal of this step is to accurately match VDJ libraries (clonotype identity) with GEX libraries (transcriptome function) at the single-cell level, thereby correlating the clonotype characteristics of cells with their functional states.
Mapping Principle
Since VDJ libraries and 5' GEX libraries share the same cell barcode system, we can precisely associate each cell's TCR/BCR sequence information with its transcriptome expression profile. This enables us to study the characteristics of immune receptors in specific cell subsets (such as exhausted T cells, memory B cells).
Mapping Result Interpretation
Through dimensionality reduction visualization methods such as UMAP, we can intuitively display the distribution of VDJ information in different cell subsets.
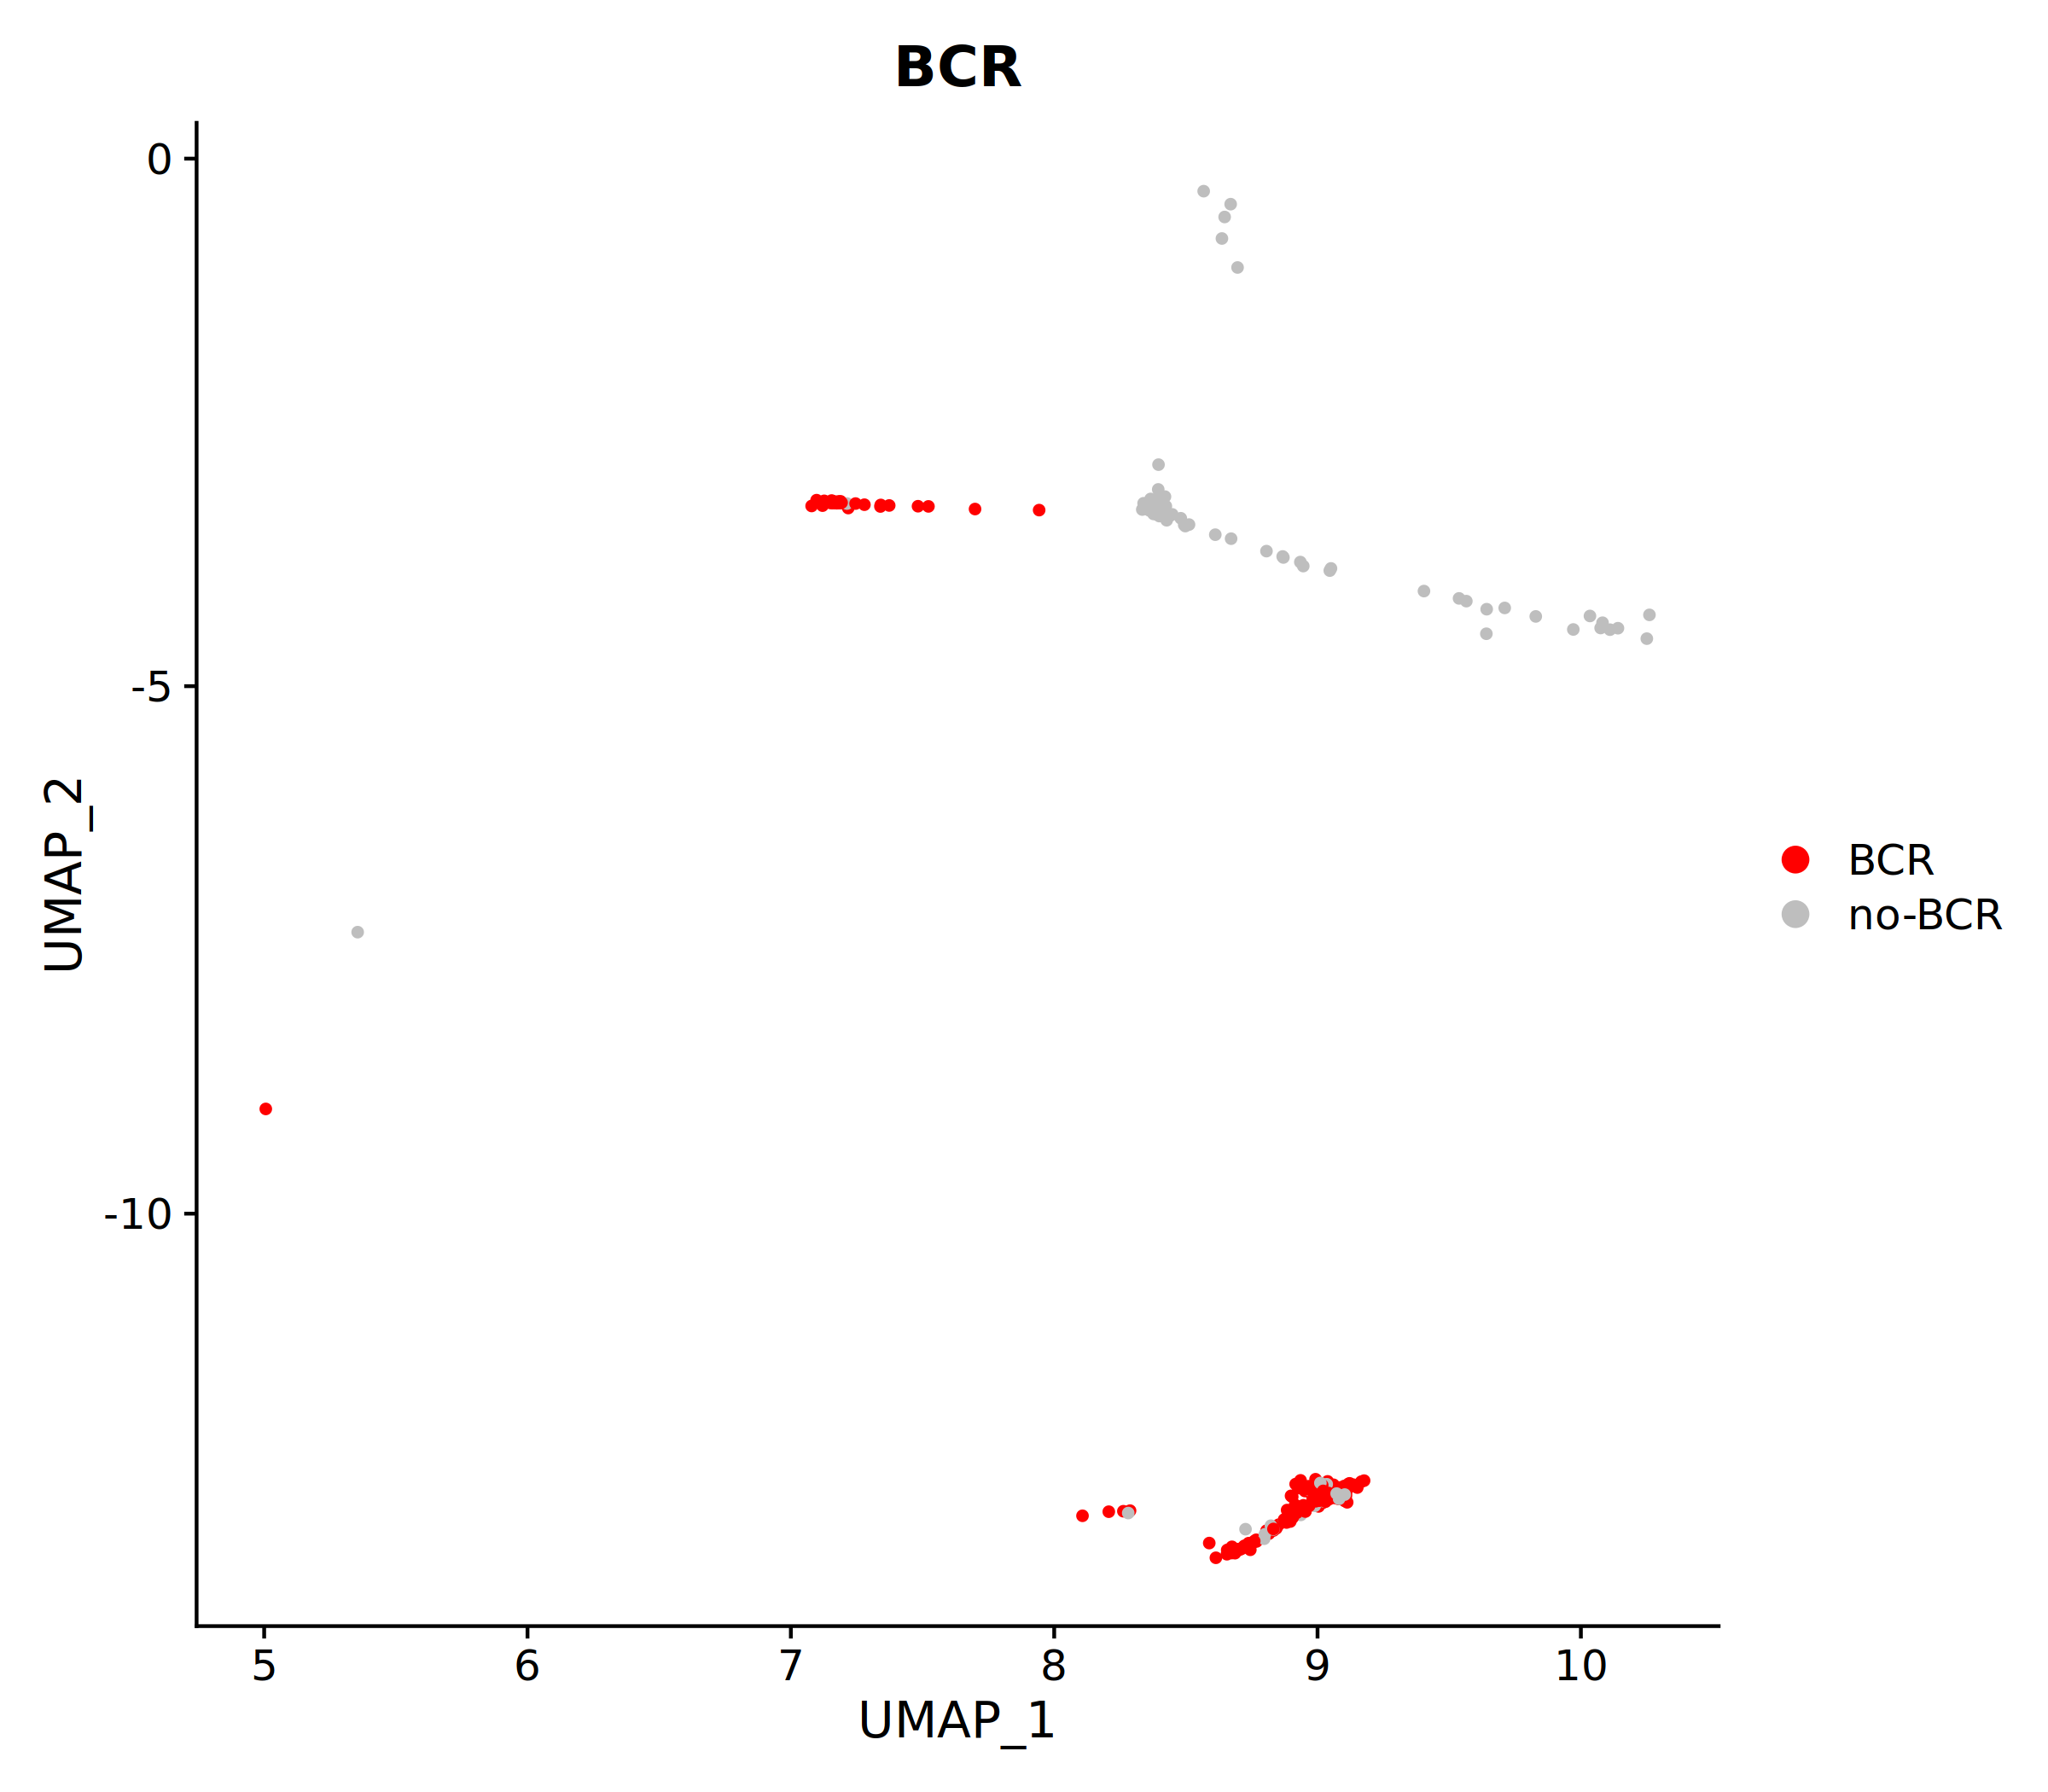
The figure above shows the distribution of BCR-detected cells (red) in the UMAP clustering plot. By observing which cell populations the red cells are mainly enriched in, we can analyze the BCR detection rates of different B cell subsets and their biological significance.
- "TCR/BCR" Cells: Cells in the VDJ library in which immune receptor sequences were successfully detected.
- "no-TCR/BCR" Cells: Cells in which no immune receptor sequences were detected. Possible reasons include:
- The cell itself does not express TCR/BCR (such as macrophages, fibroblasts).
- The expression level of immune receptor genes is extremely low, below the detection threshold.
- Insufficient cell lysis or poor V(D)J enrichment efficiency.
NOTE
The detection rate of cell mapping is one of the important indicators for measuring experimental quality. A low detection rate may mean that experimental conditions need to be optimized or sequencing depth needs to be increased. By analyzing the detection rates of specific cell types, important clues can be provided for subsequent functional studies.
V/J Gene Feature Analysis
The usage frequency and pairing patterns of V/J genes are key features of immunoglobulin repertoires, reflecting the immune system's response preferences and clonal selection against antigens. Through the analysis of these features, we can gain deeper insights into the breadth and specificity of immune responses.
V/J Gene Usage Frequency (Gene Usage)
This analysis counts the usage frequency of V genes and J genes in the immunoglobulin repertoire. During immune responses, certain V/J genes may be preferentially selected and expanded because they can effectively recognize specific antigens, resulting in their proportion in the repertoire being significantly higher than other genes.
- Analysis Method: Statistics on the abundance distribution of V genes and J genes for each cell type in the overall and each group are performed separately.
- Result Interpretation: Bar charts are typically used to display the relative abundance of each V/J gene. The X-axis in the chart represents different V or J genes, and the Y-axis represents their percentage (frequency) in the total clonotypes. Genes with dominant expression (i.e., higher bars) may be related to the specific immune state of the sample.
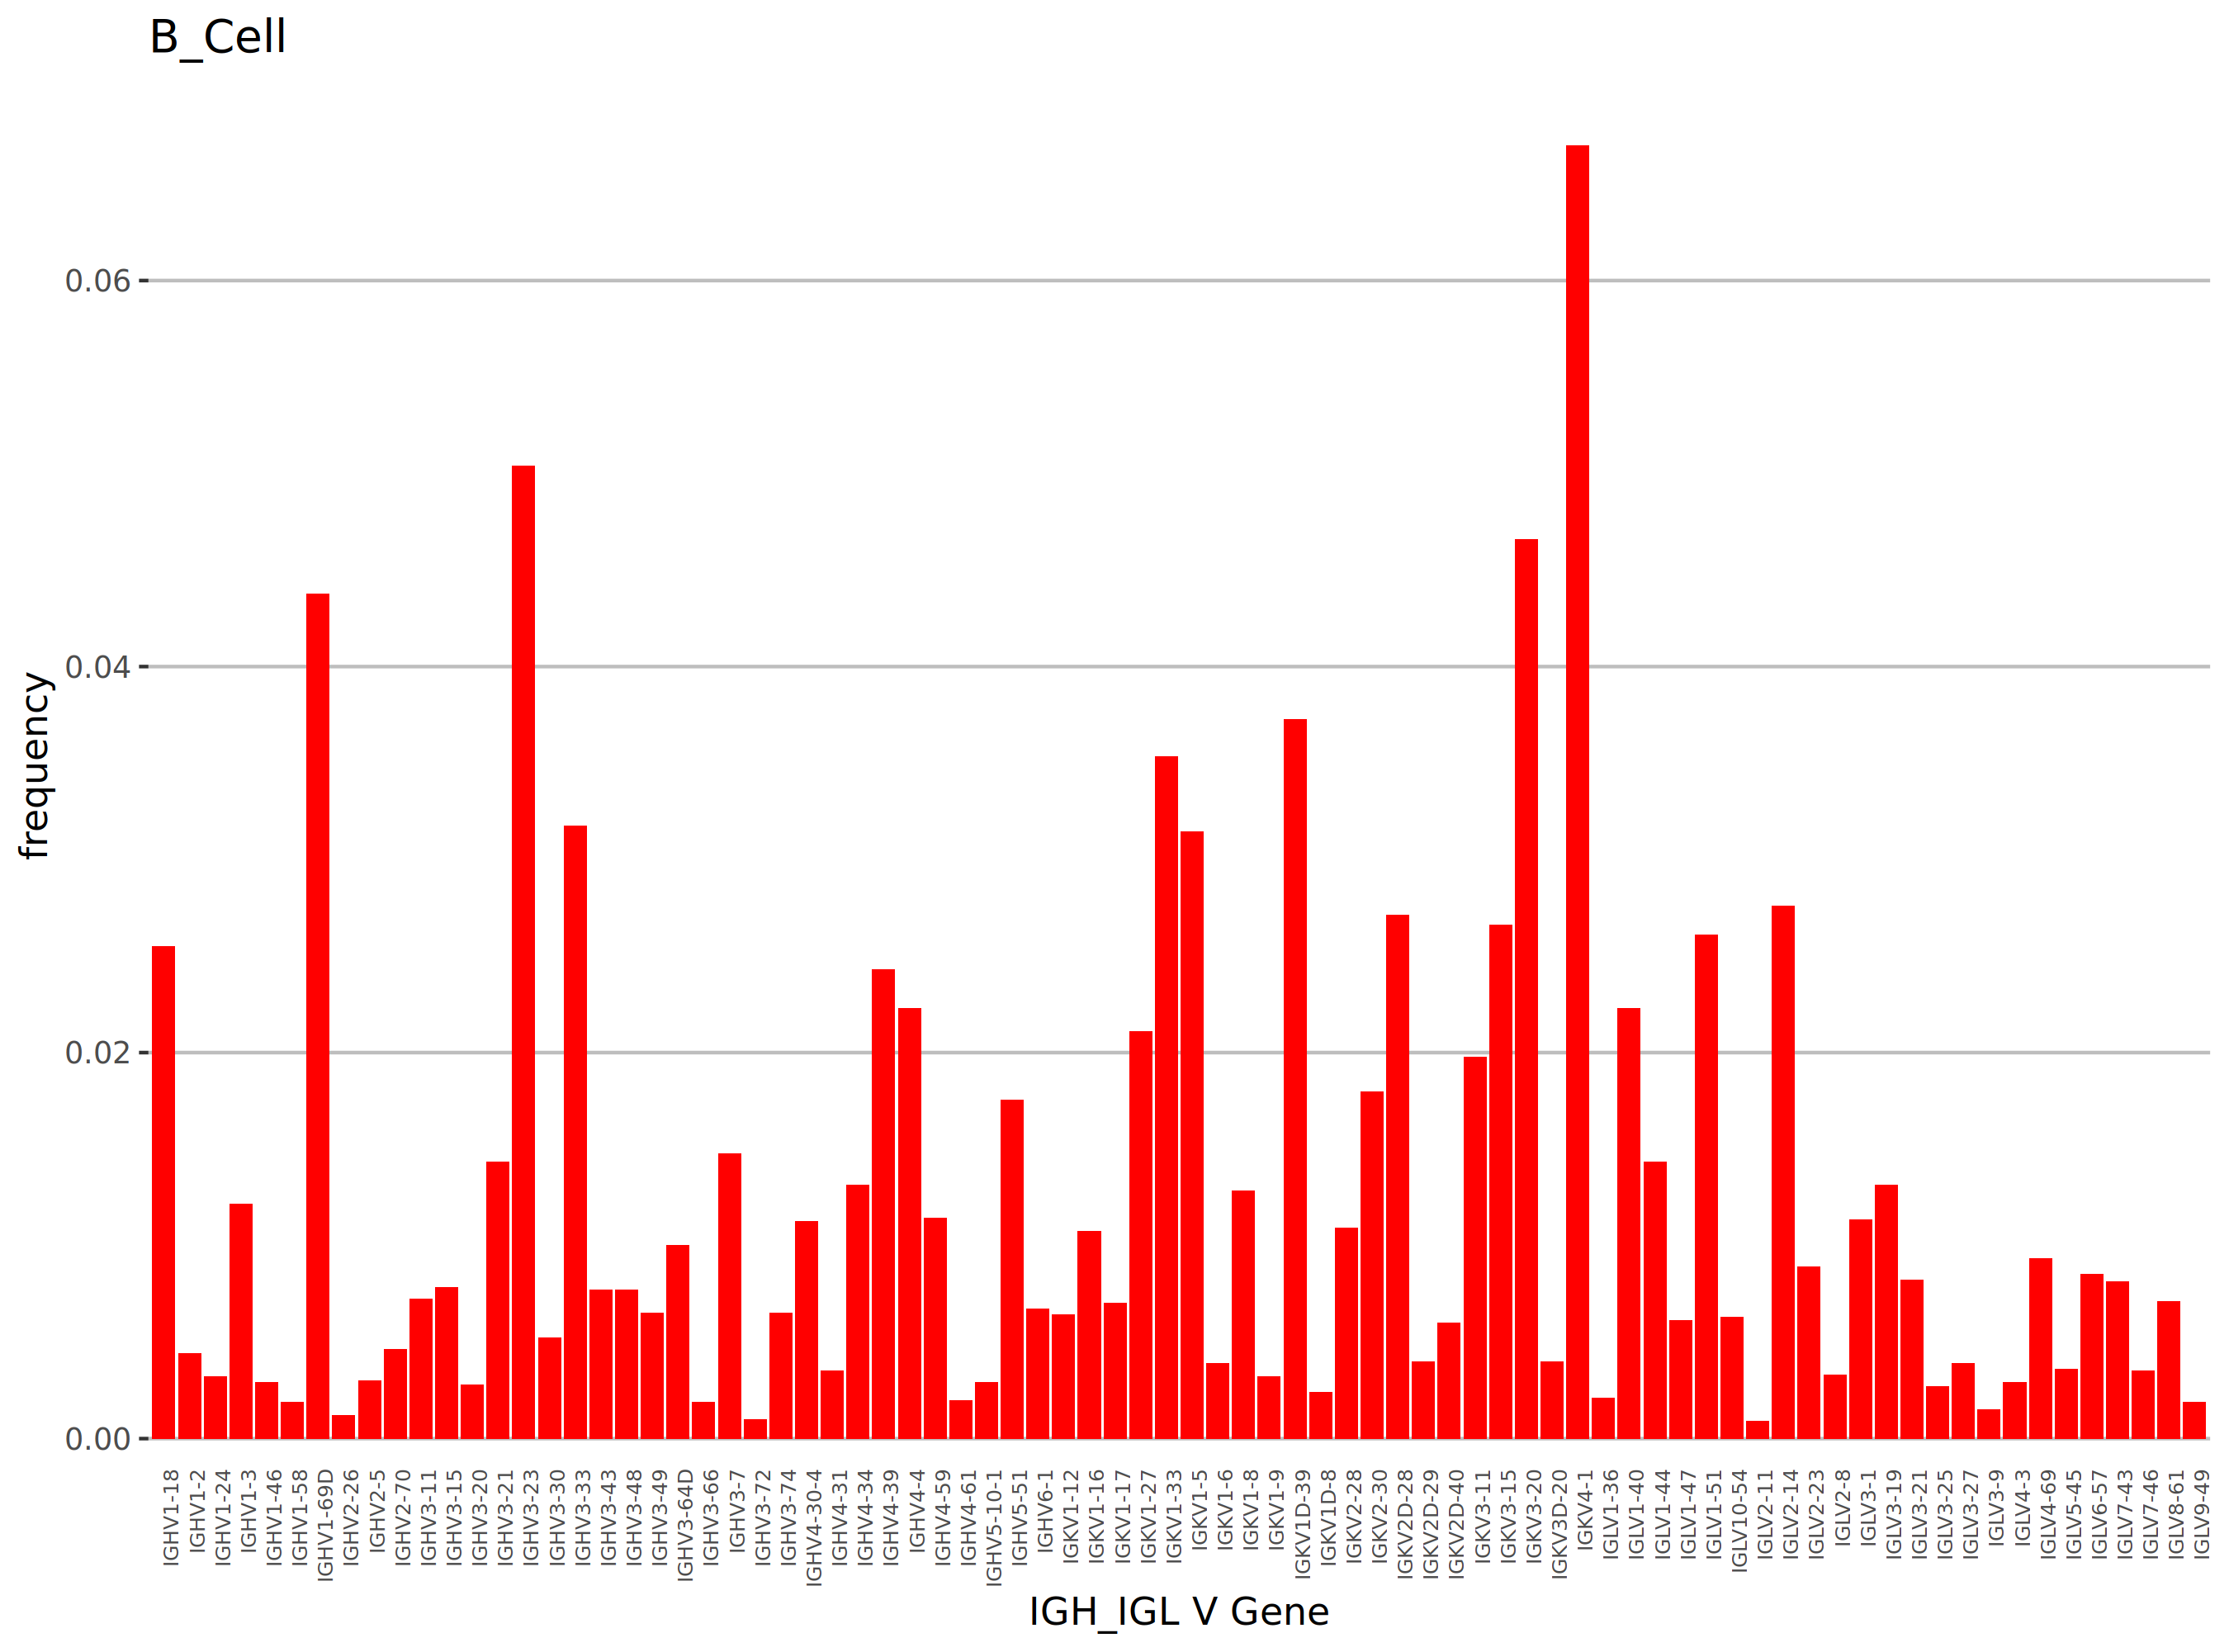
Taking BCR as an example, TCR analysis works similarly. The figure above shows the distribution of usage frequencies of different V genes in B cells, allowing for intuitive identification of the dominant genes with the highest abundance. The abscissa represents IGH_IGL V gene names, and the ordinate represents frequency.
TIP
Key Points for Interpretation:
- By comparing V/J gene usage patterns between different cell types or samples, specific immune response characteristics can be identified.
- Significantly enriched V/J genes may indicate the presence of clonal expansion against specific antigens.
- Combined with subsequent differential analysis heatmaps, a more comprehensive assessment of V/J gene usage differences between cell types can be achieved.
V/J Gene Differential Analysis
For a more systematic comparison of V/J gene usage differences between different cell types, differential analysis of V/J gene frequencies between cell types in the overall and each group can be performed.
- Result Interpretation: Each row in the heatmap represents a V or J gene, and each column represents a cell type. The color coding indicates the standardized score (Z-Score) of gene usage frequency, with orange/red indicating higher usage frequency of the gene in that cell type (upregulated) and blue indicating lower usage frequency (downregulated). Through hierarchical clustering, groups of cell types with similar V/J gene usage patterns can be identified.
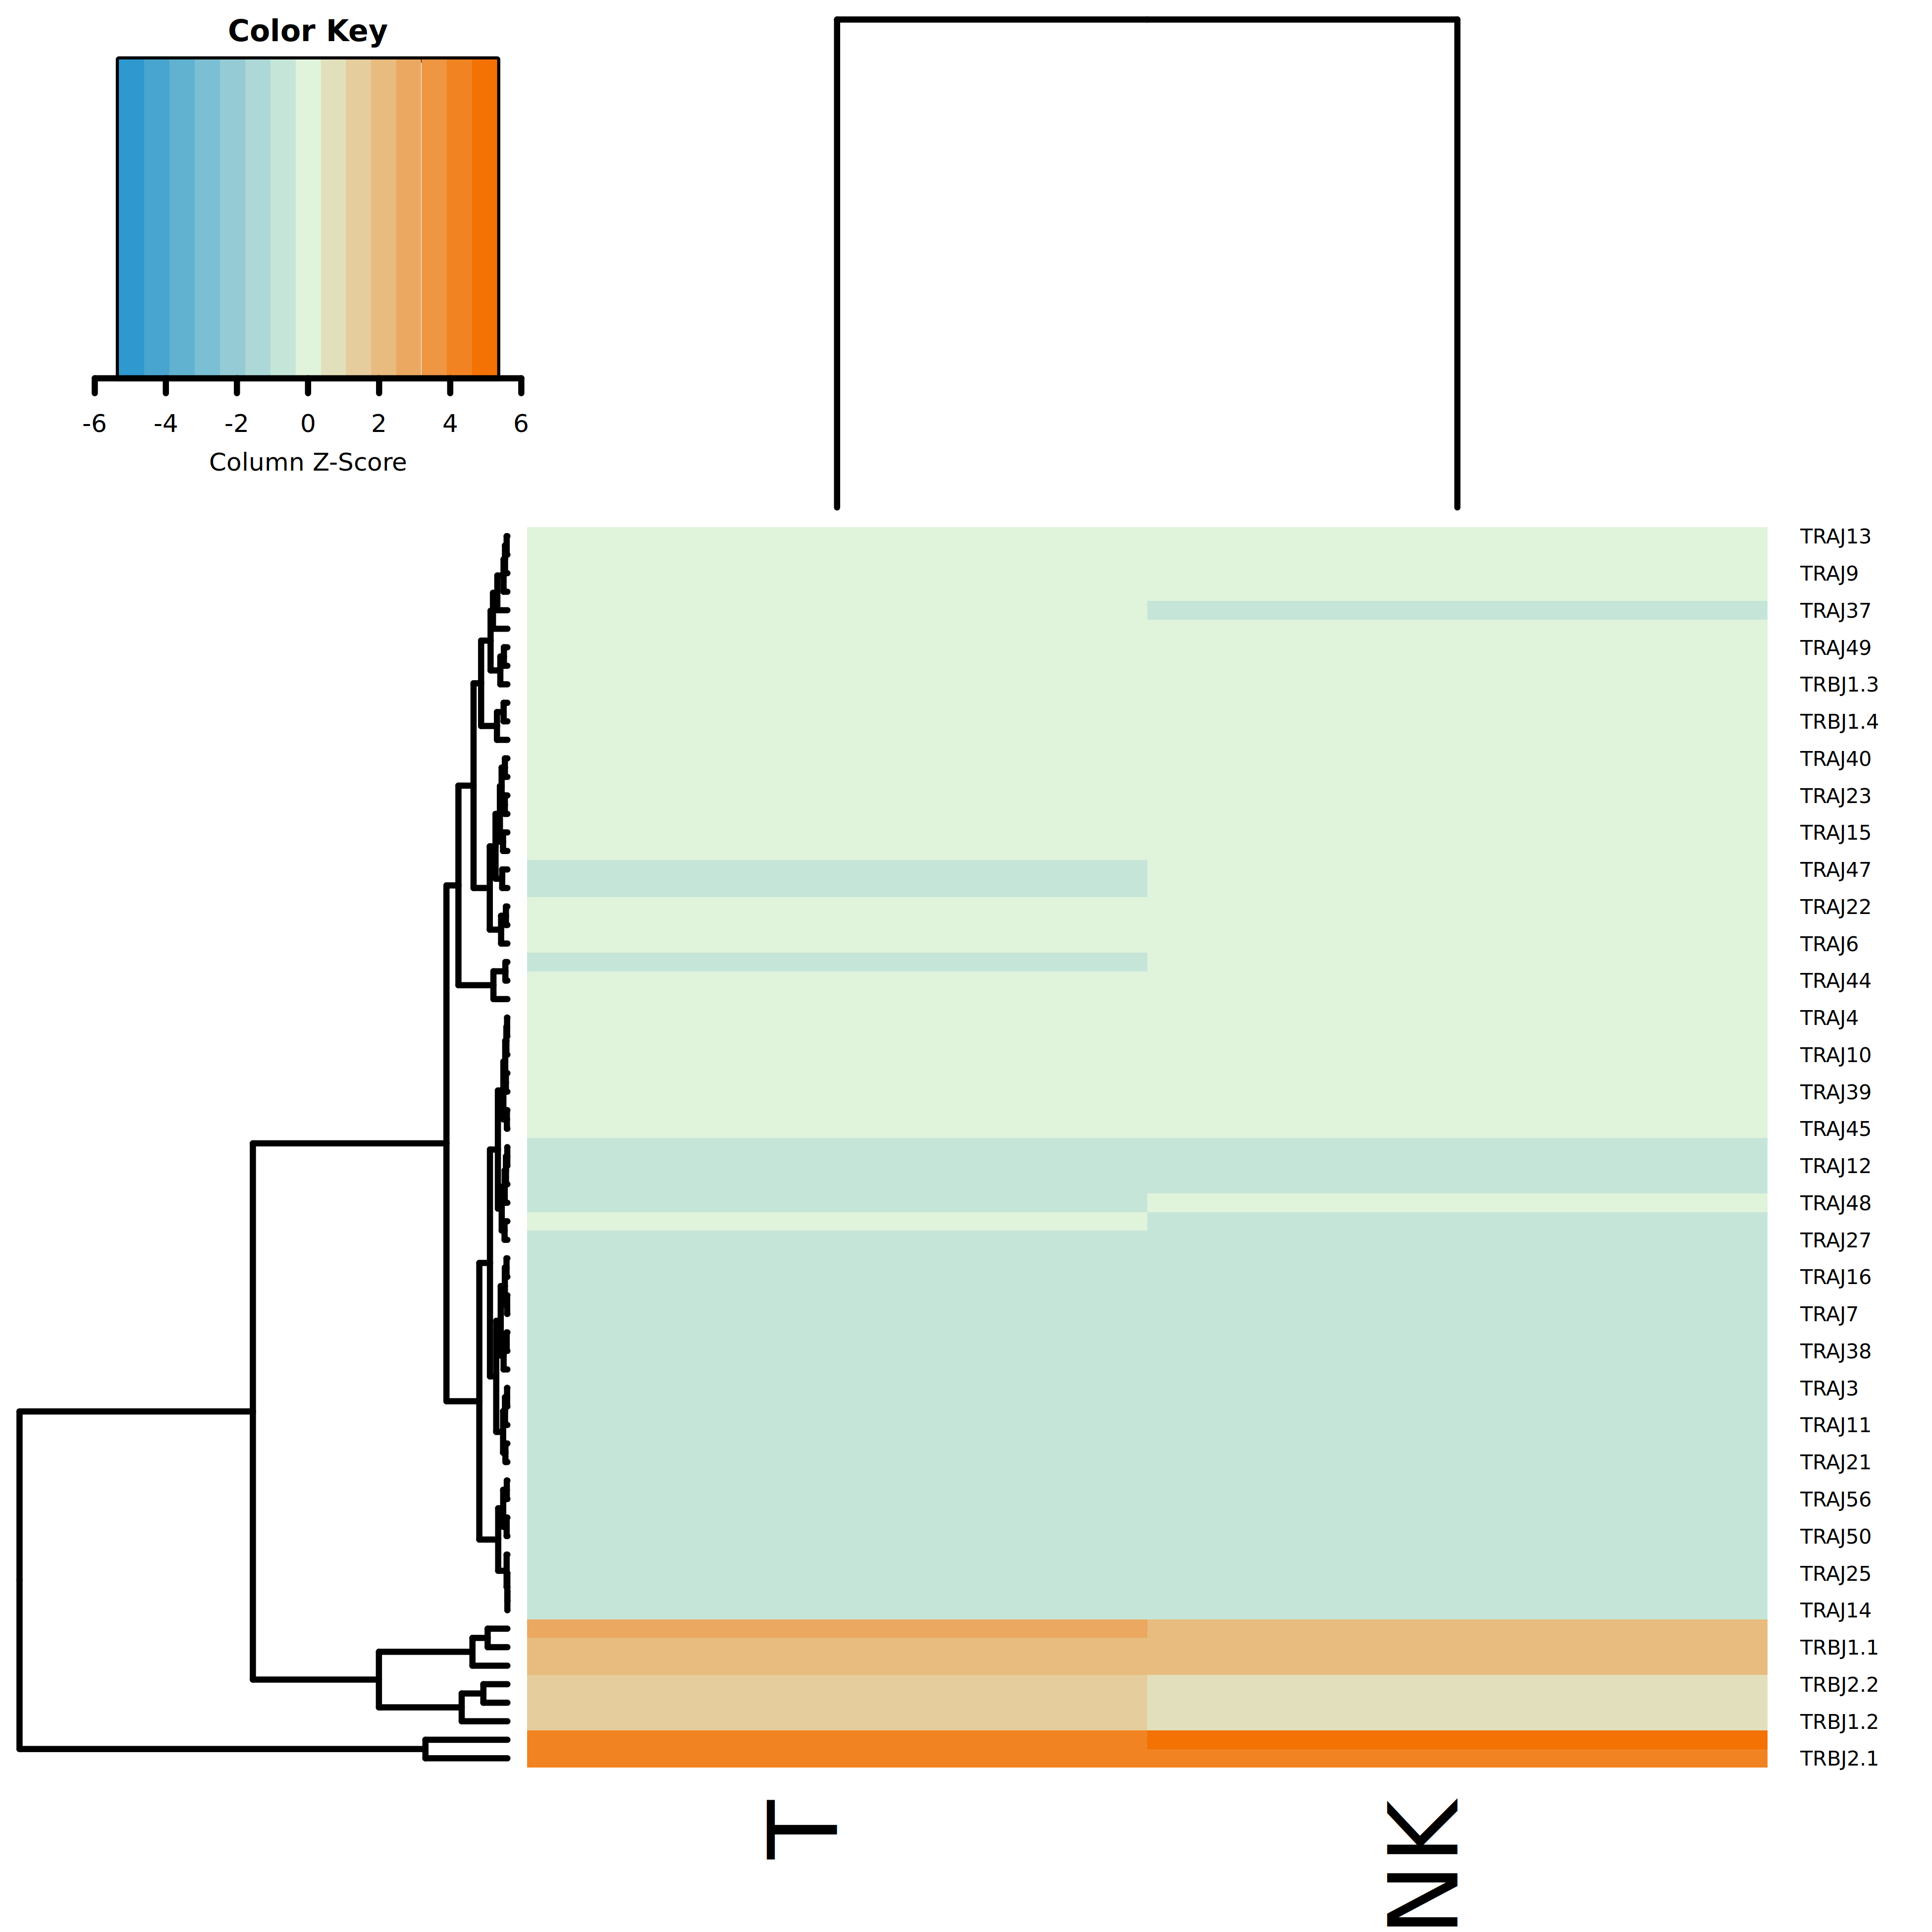
The figure above shows a differential analysis heatmap of J gene usage frequencies between different cell types. Cell type-specific gene usage patterns can be identified through color intensity and clustering trees.
V-J Gene Pairing Analysis
In addition to the usage frequency of individual genes, the pairing combinations of V and J genes also contain important biological information. Certain specific V-J gene combinations may be more preferentially selected, forming dominant pairings, which similarly suggests their important role in antigen recognition.
- Analysis Method: Statistical analysis of the pairing frequency of V-J gene pairs in different immunoglobulin repertoires can reflect the variation characteristics of CDR3 or the immunoglobulin repertoire. By comparing high-abundance V-J gene pairs in different immune periods, specifically expressed immune gene combinations can be identified.
- Result Interpretation: V-J pairing information is often visualized through Chord Diagrams. Chord diagrams can intuitively display the connection relationships between different V genes (on one side of the outer ring) and J genes (on the other side of the outer ring), with the width of the connecting bands being proportional to the abundance of that V-J pairing. Wider bands indicate a higher frequency of that pairing combination in the sample.

The figure above clearly shows the dominant V-J pairing combinations and their relative abundances in T cells through a V-J gene pairing chord diagram. The outer ring displays different V and J genes, and the width of the connecting lines represents pairing frequency.
CDR3 Feature Analysis
The CDR3 region is the core of the variable region of TCR/BCR and directly determines the specificity of antigen binding. This region is jointly encoded by V, D, and J gene segments and forms extremely high diversity through random nucleotide insertions and deletions. Therefore, feature analysis of CDR3 is of paramount importance in immunoglobulin repertoire research.
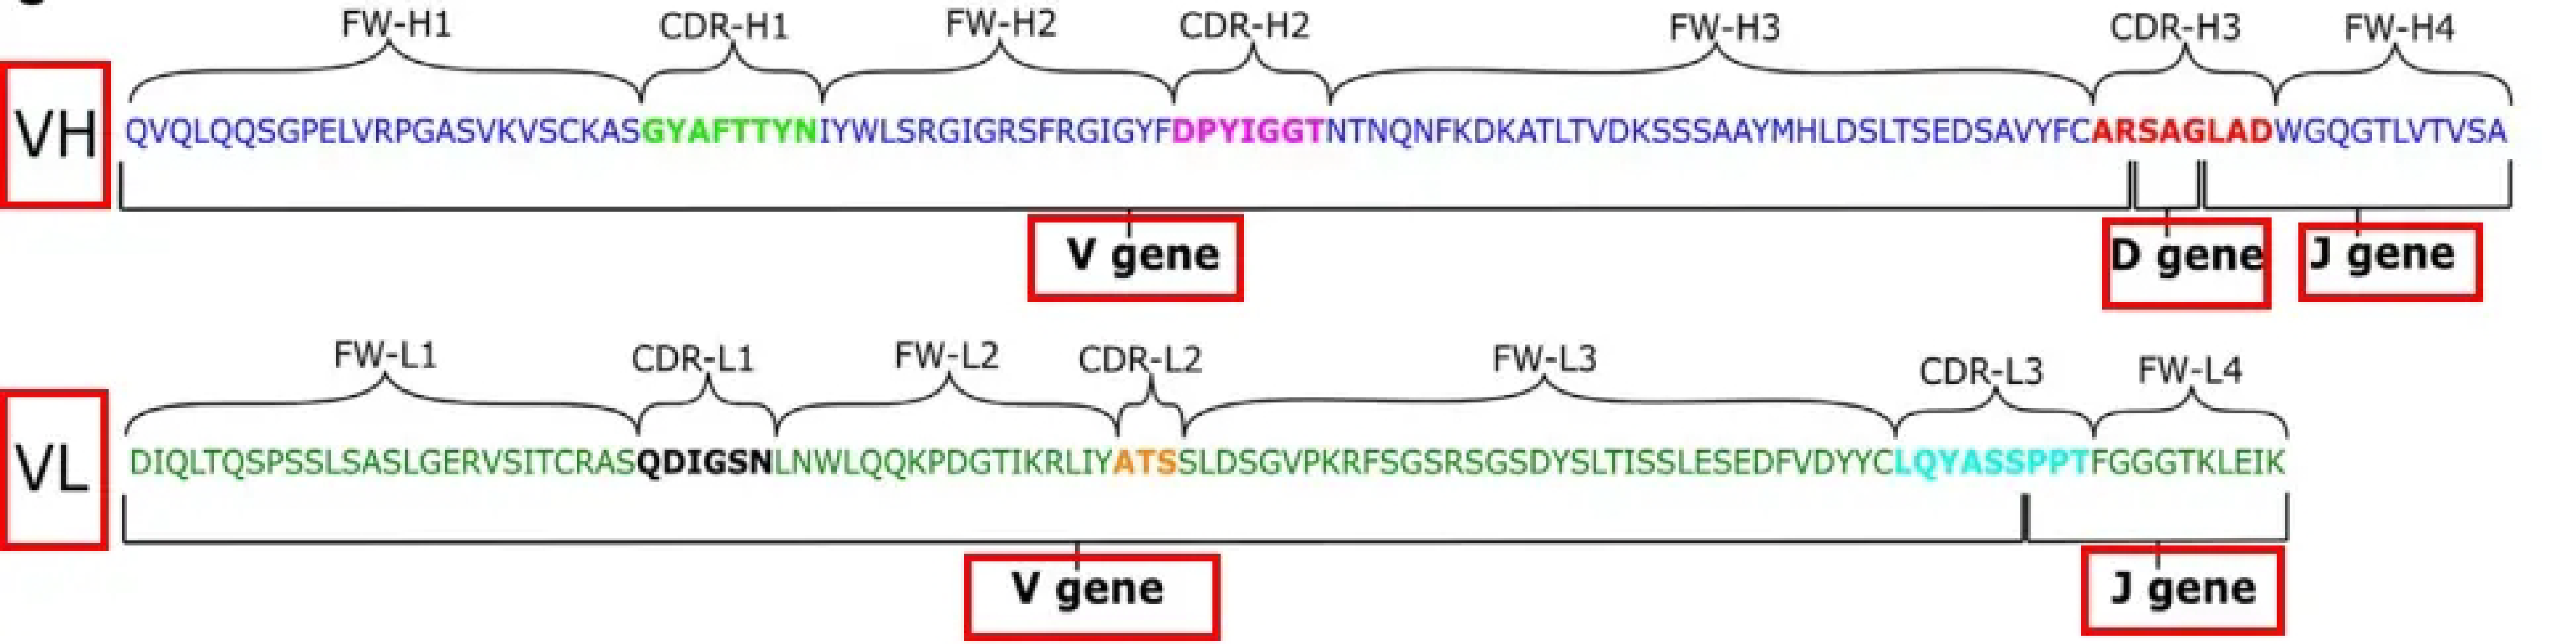
The variable regions of BCR and TCR contain three complementarity determining regions (CDR1/CDR2/CDR3), with CDR3 having the highest variation and directly determining antigen binding specificity.
CDR3 Sequence Length and V Gene Combination Analysis
Analyzing the combination characteristics of CDR3 and V genes can further reveal the patterns of clonal selection. The relationship between CDR3 length distribution and V gene usage frequency can be simultaneously displayed through a "Spectratype Plot."
- Analysis Method: Statistics on the distribution of V genes under different CDR3 sequence lengths in the overall and each group are performed.
- Result Interpretation: In the spectratype plot, the X-axis represents the base sequence length (bp) of CDR3, and the Y-axis represents frequency. Each bar represents CDR3 of a specific length, and different colored segments within the bar represent the different V gene sources and their proportions that constitute that length of CDR3. The top 12 abundant V genes are filled with different colors in the figure, and the rest are gray (Other). This helps identify whether there are dominant combinations of specific lengths of CDR3 with specific V genes.
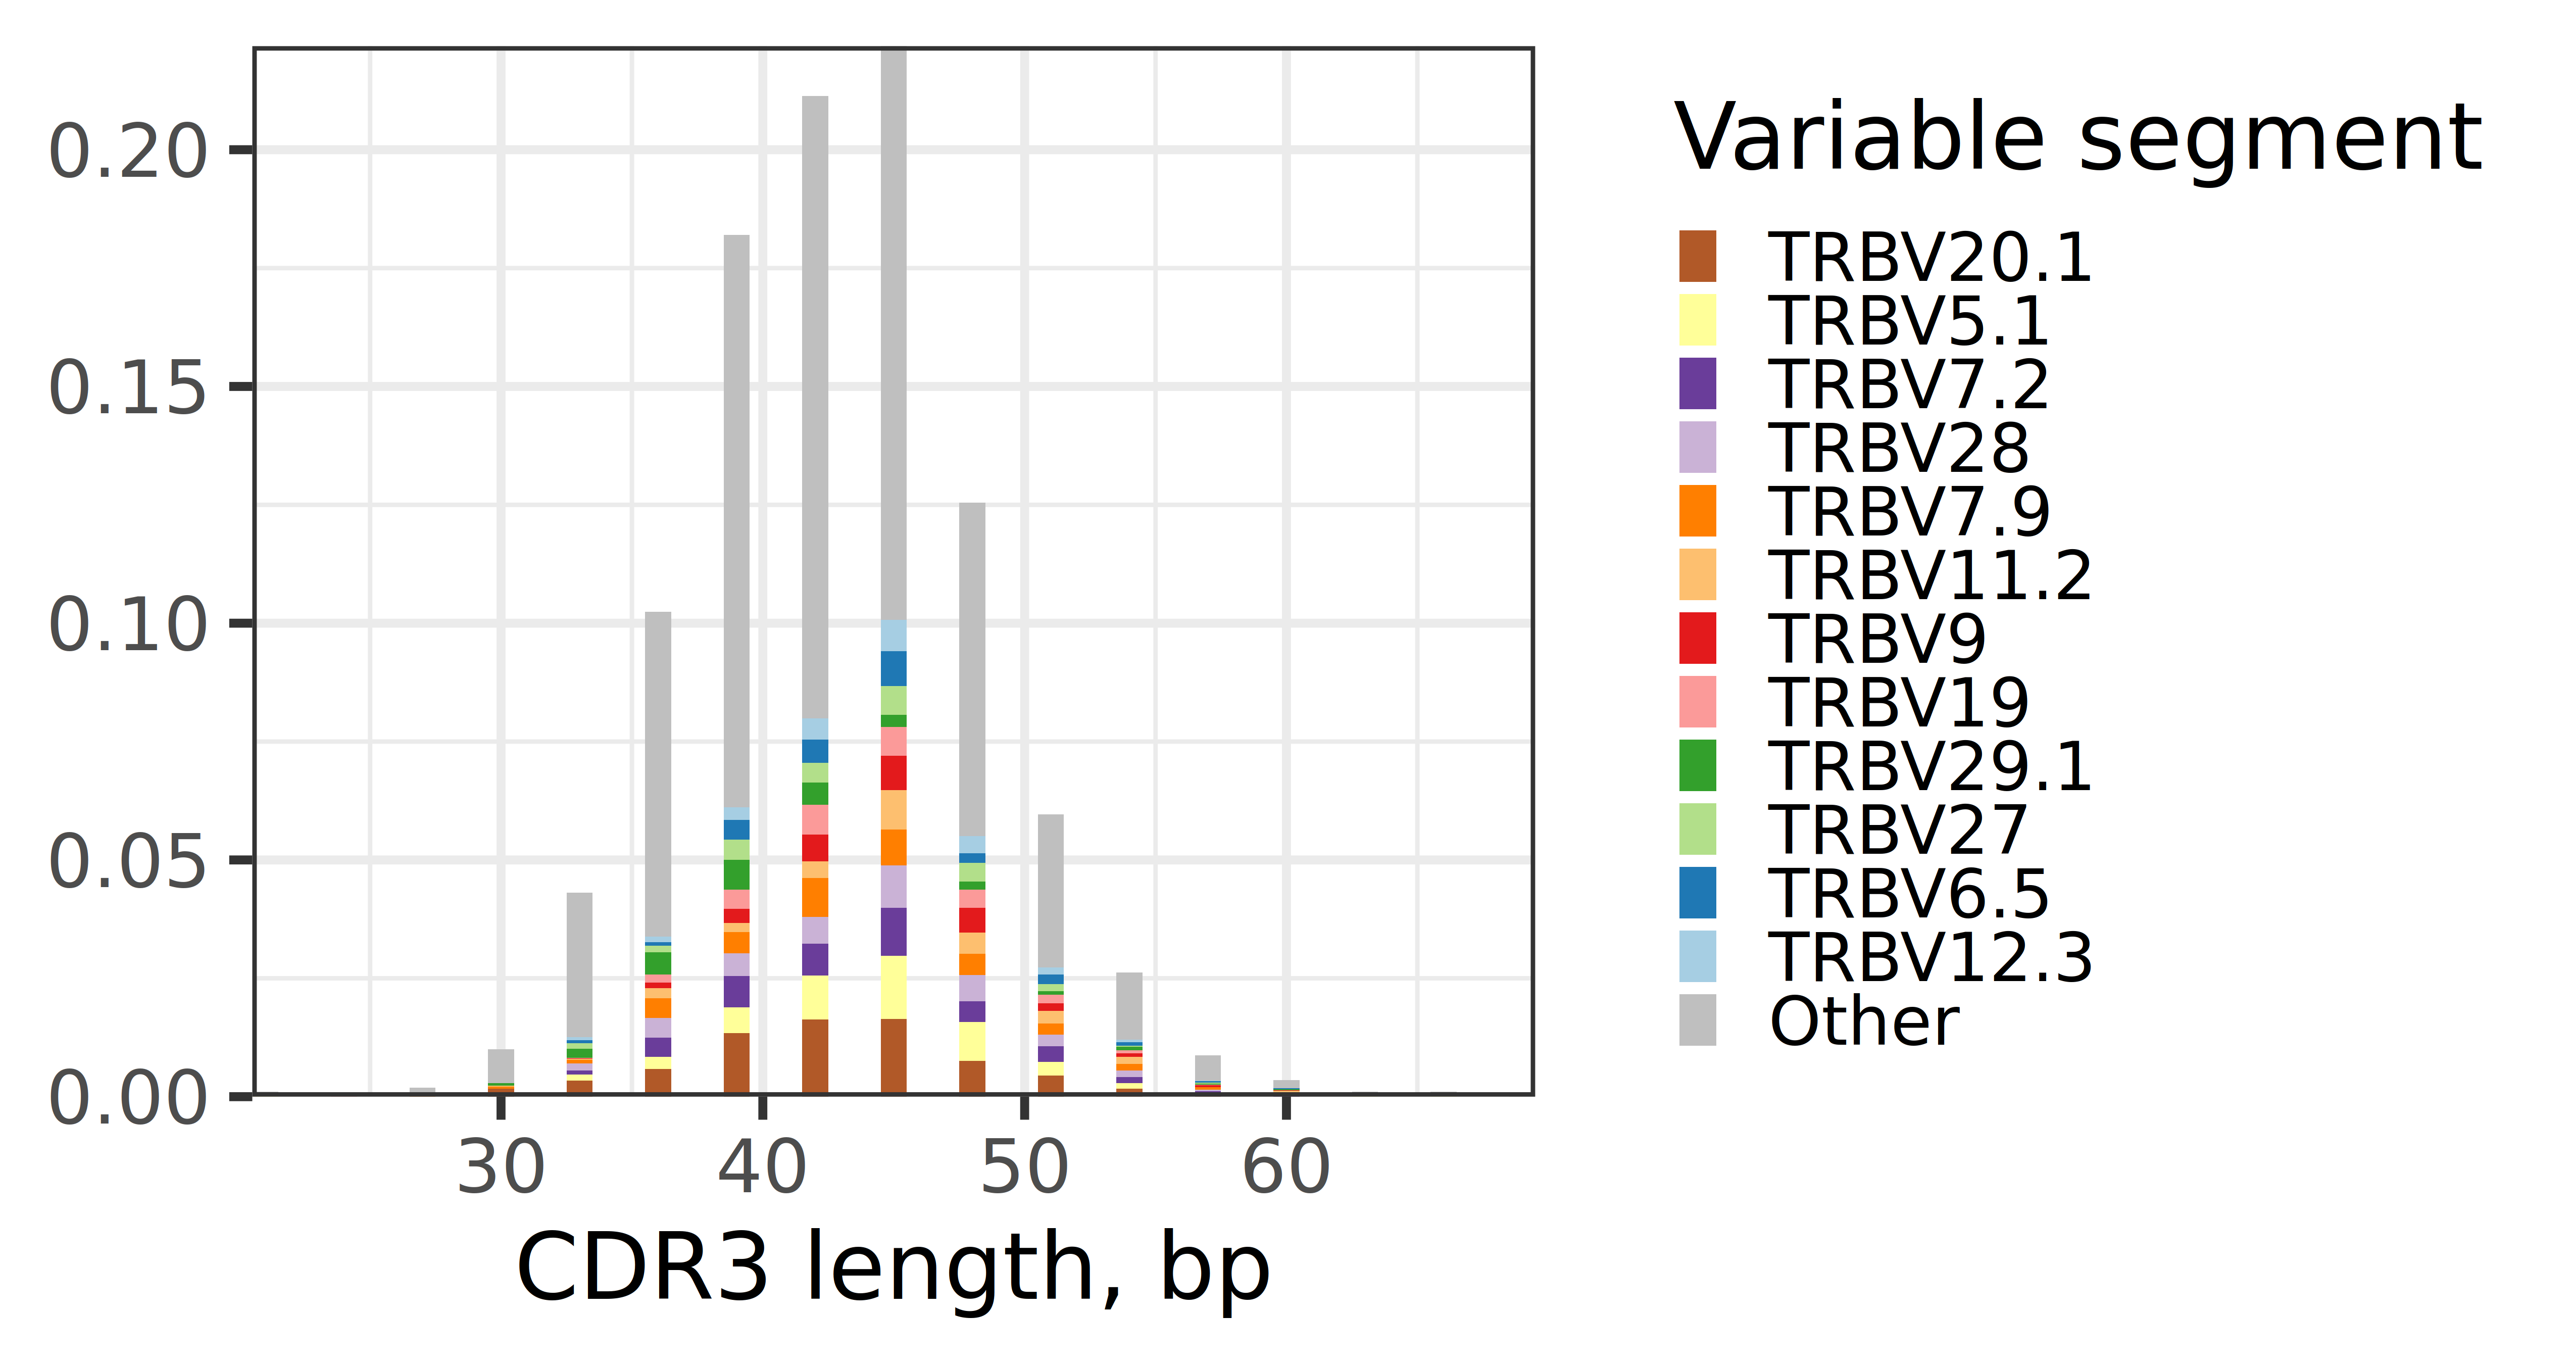
The figure above shows the distribution of various V genes under different CDR3 lengths in T cells. The abscissa represents CDR3 base sequence length, the ordinate represents frequency, and different colors represent different V genes (TRBV). This figure can be used to analyze whether specific V genes tend to form CDR3 of specific lengths.
NOTE
Biological Significance:
- The combination pattern of CDR3 length and V genes reflects the structural characteristics and diversity of immune receptors.
- Some V genes may tend to produce CDR3 within a specific length range, which is related to the structural characteristics of their coding regions.
- Abnormal CDR3 length distribution or V gene preference may indicate the presence of clonal expansion or immune selection.
CDR3 Length Distribution Statistics
CDR3 is the core region encoded by V(D)J genes, usually containing a portion of the V gene, the entire D gene, and a portion of the J gene, making it the most representative and identifiable region on BCR/TCR. In the vast majority of immunological studies, CDR3 sequences are used as the sole basis for defining and identifying a specific BCR or TCR, meaning that cells with the same CDR3 sequence belong to one clonotype. The length of CDR3 sequences is not completely random, and their distribution characteristics can reflect the overall state of the immunoglobulin repertoire and the degree of clonal expansion.
Biological Significance of CDR3 Length Distribution
In a normal immune system, CDR3 length typically presents a quasi-Gaussian (bell-shaped) distribution, reflecting the diversity and randomness of the immunoglobulin repertoire.
- Normal Distribution: A diverse immunoglobulin repertoire typically manifests as a bell-shaped curve covering multiple lengths and symmetric in shape, suggesting that the immune system has broad antigen recognition capabilities.
- Distribution Shift or Oligoclonal Dominance: When the body produces a strong immune response against a specific antigen (such as viral infection or tumor), a small number of T/B cells that efficiently recognize the antigen will undergo massive expansion. This leads to the formation of one or several prominent peaks in the distribution map corresponding to their CDR3 lengths, causing the overall distribution to deviate from the standard form. Therefore, CDR3 length distribution is an intuitive indicator for assessing the degree of clonal expansion.
CDR3 Length Distribution Analysis Method
Statistics on the CDR3 sequence length distribution for each cell type in the overall and each group are performed separately.
- Histogram Display: The abscissa represents CDR3 sequence length, and the ordinate represents cell count (counts), which can intuitively display the absolute number of each length.
- Line Chart Display: The abscissa represents CDR3 sequence length (CDR3 Length), and the ordinate represents proportion (Percent), which can clearly compare CDR3 length distribution patterns between different cell types or samples.
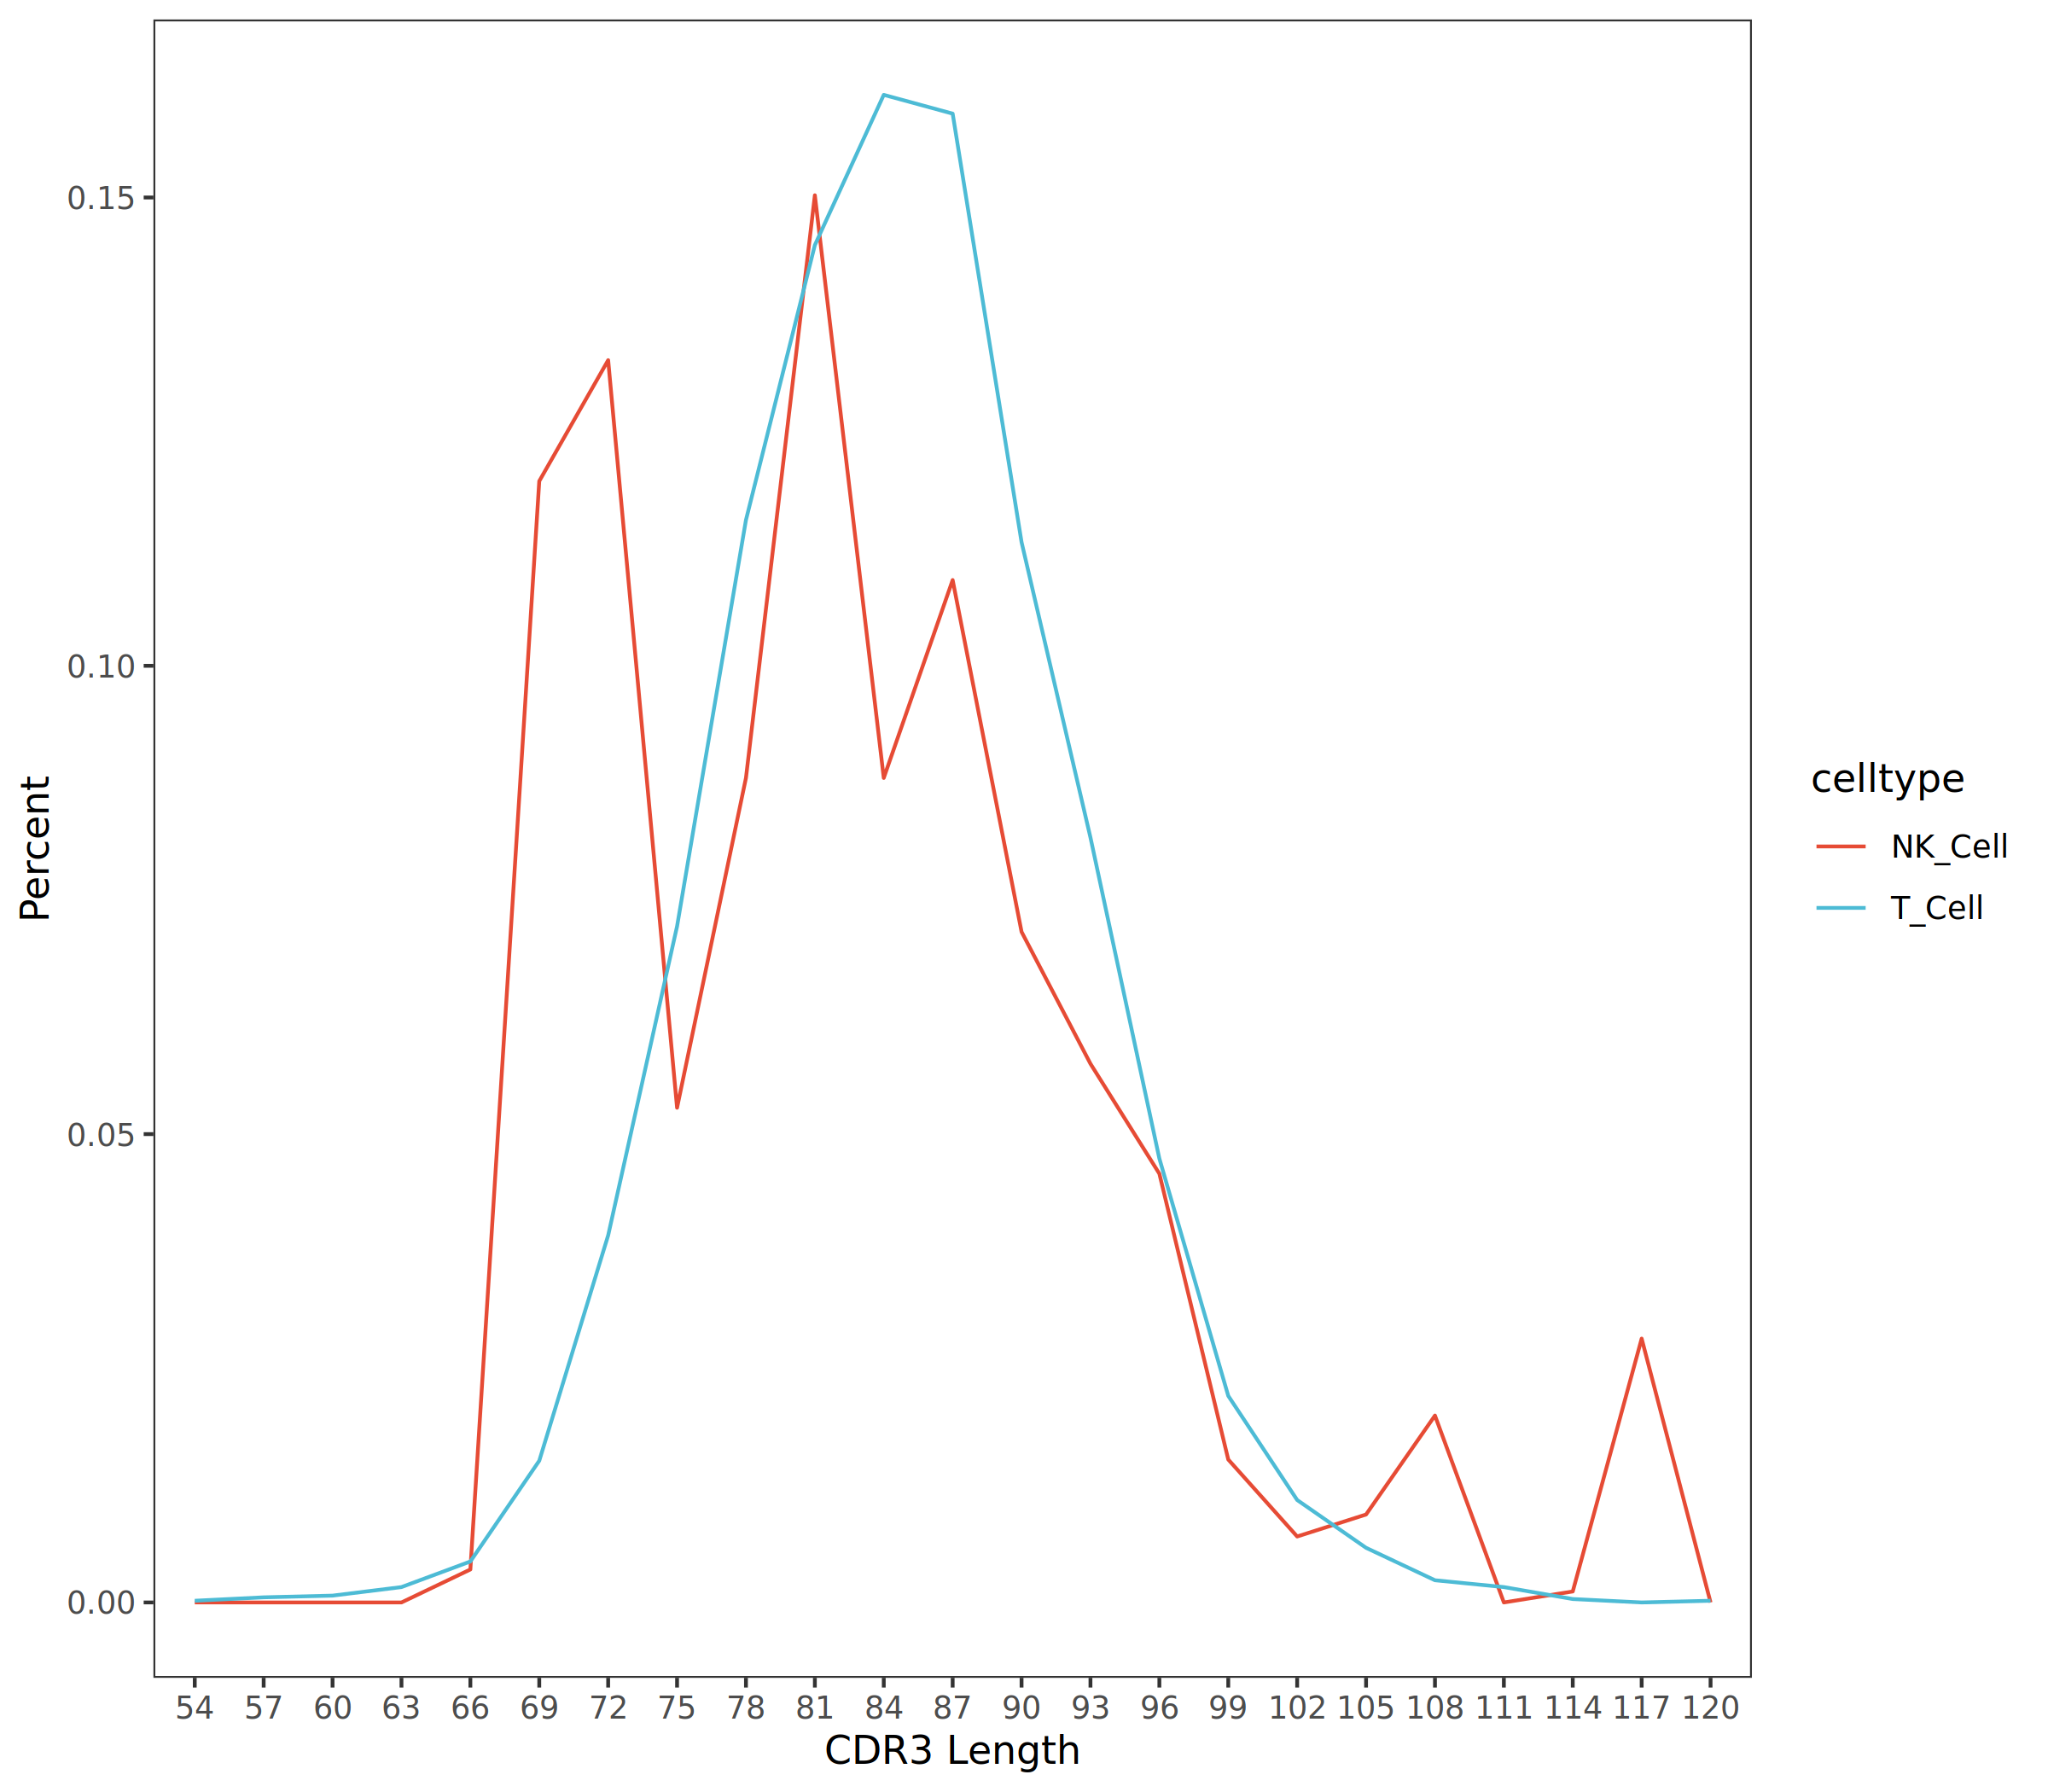
The figure above shows the CDR3 length distribution in different cell populations (T_Cell and NK_Cell). The abscissa represents CDR3 length, and the ordinate represents percentage. By comparing the distribution curves of different cell populations, the clonal expansion status and immunoglobulin repertoire diversity of each cell population can be assessed. T cells and NK cells exhibit different CDR3 length distribution characteristics, with T cells having peaks mainly concentrated around 81-87bp, while NK cells have two peaks around 72bp and 81bp.
TIP
Key Points for Result Interpretation:
- A symmetric bell-shaped curve indicates normal immunoglobulin repertoire diversity.
- Significant peaks or peak shifts may indicate the presence of clonal expansion or immune selection.
- Different cell types may have different CDR3 length distribution characteristics, which are related to their functional states and developmental stages.
- Measuring the frequency of specific CDR3 sequences can reflect the degree of immune cell expansion, providing a basis for subsequent clonotype analysis.
Clone Abundance Statistics
Clone Abundance, also known as Clone Size, refers to the number of cells with the same CDR3 sequence. Clone abundance statistics are an important indicator for assessing the clonal expansion status of the immunoglobulin repertoire, which can intuitively reflect the intensity and specificity of the immune response.
Biological Significance of Clone Abundance
Under normal physiological conditions, most clonotypes in the immunoglobulin repertoire contain only a small number of cells (clone size ≤ 2), showing a highly diverse state. However, when the body encounters specific antigen stimulation (such as pathogen infection, tumor antigen, or autoantigen), T/B cells that can recognize the antigen will undergo clonal expansion, leading to a significant increase in the abundance of specific clonotypes.
- Non-clonal Cells: Clonotypes with clone size < 2, representing cell populations that have not undergone expansion or have undergone minimal expansion, reflecting the basic diversity of the immunoglobulin repertoire.
- Clonal Cells: Clonotypes with clone size ≥ 2, suggesting that these cell populations may have undergone antigen-driven clonal expansion and play important roles in immune responses.
- High-Abundance Clones: Clonotypes with very large clone sizes (such as >100) usually indicate strong immune responses or clonal dominance, which may be related to pathological states (such as chronic infections, autoimmune diseases, or tumors).
Clone Abundance Analysis Method
Statistics on the clonotype abundance distribution of each cell population in the overall and each group are performed separately. The abscissa represents the number of cells contained in each clonotype (i.e., clone abundance or clone size), and the ordinate represents the number of clonotypes with the same clone size. The clone abundance distribution patterns of different cell populations are displayed through line charts.
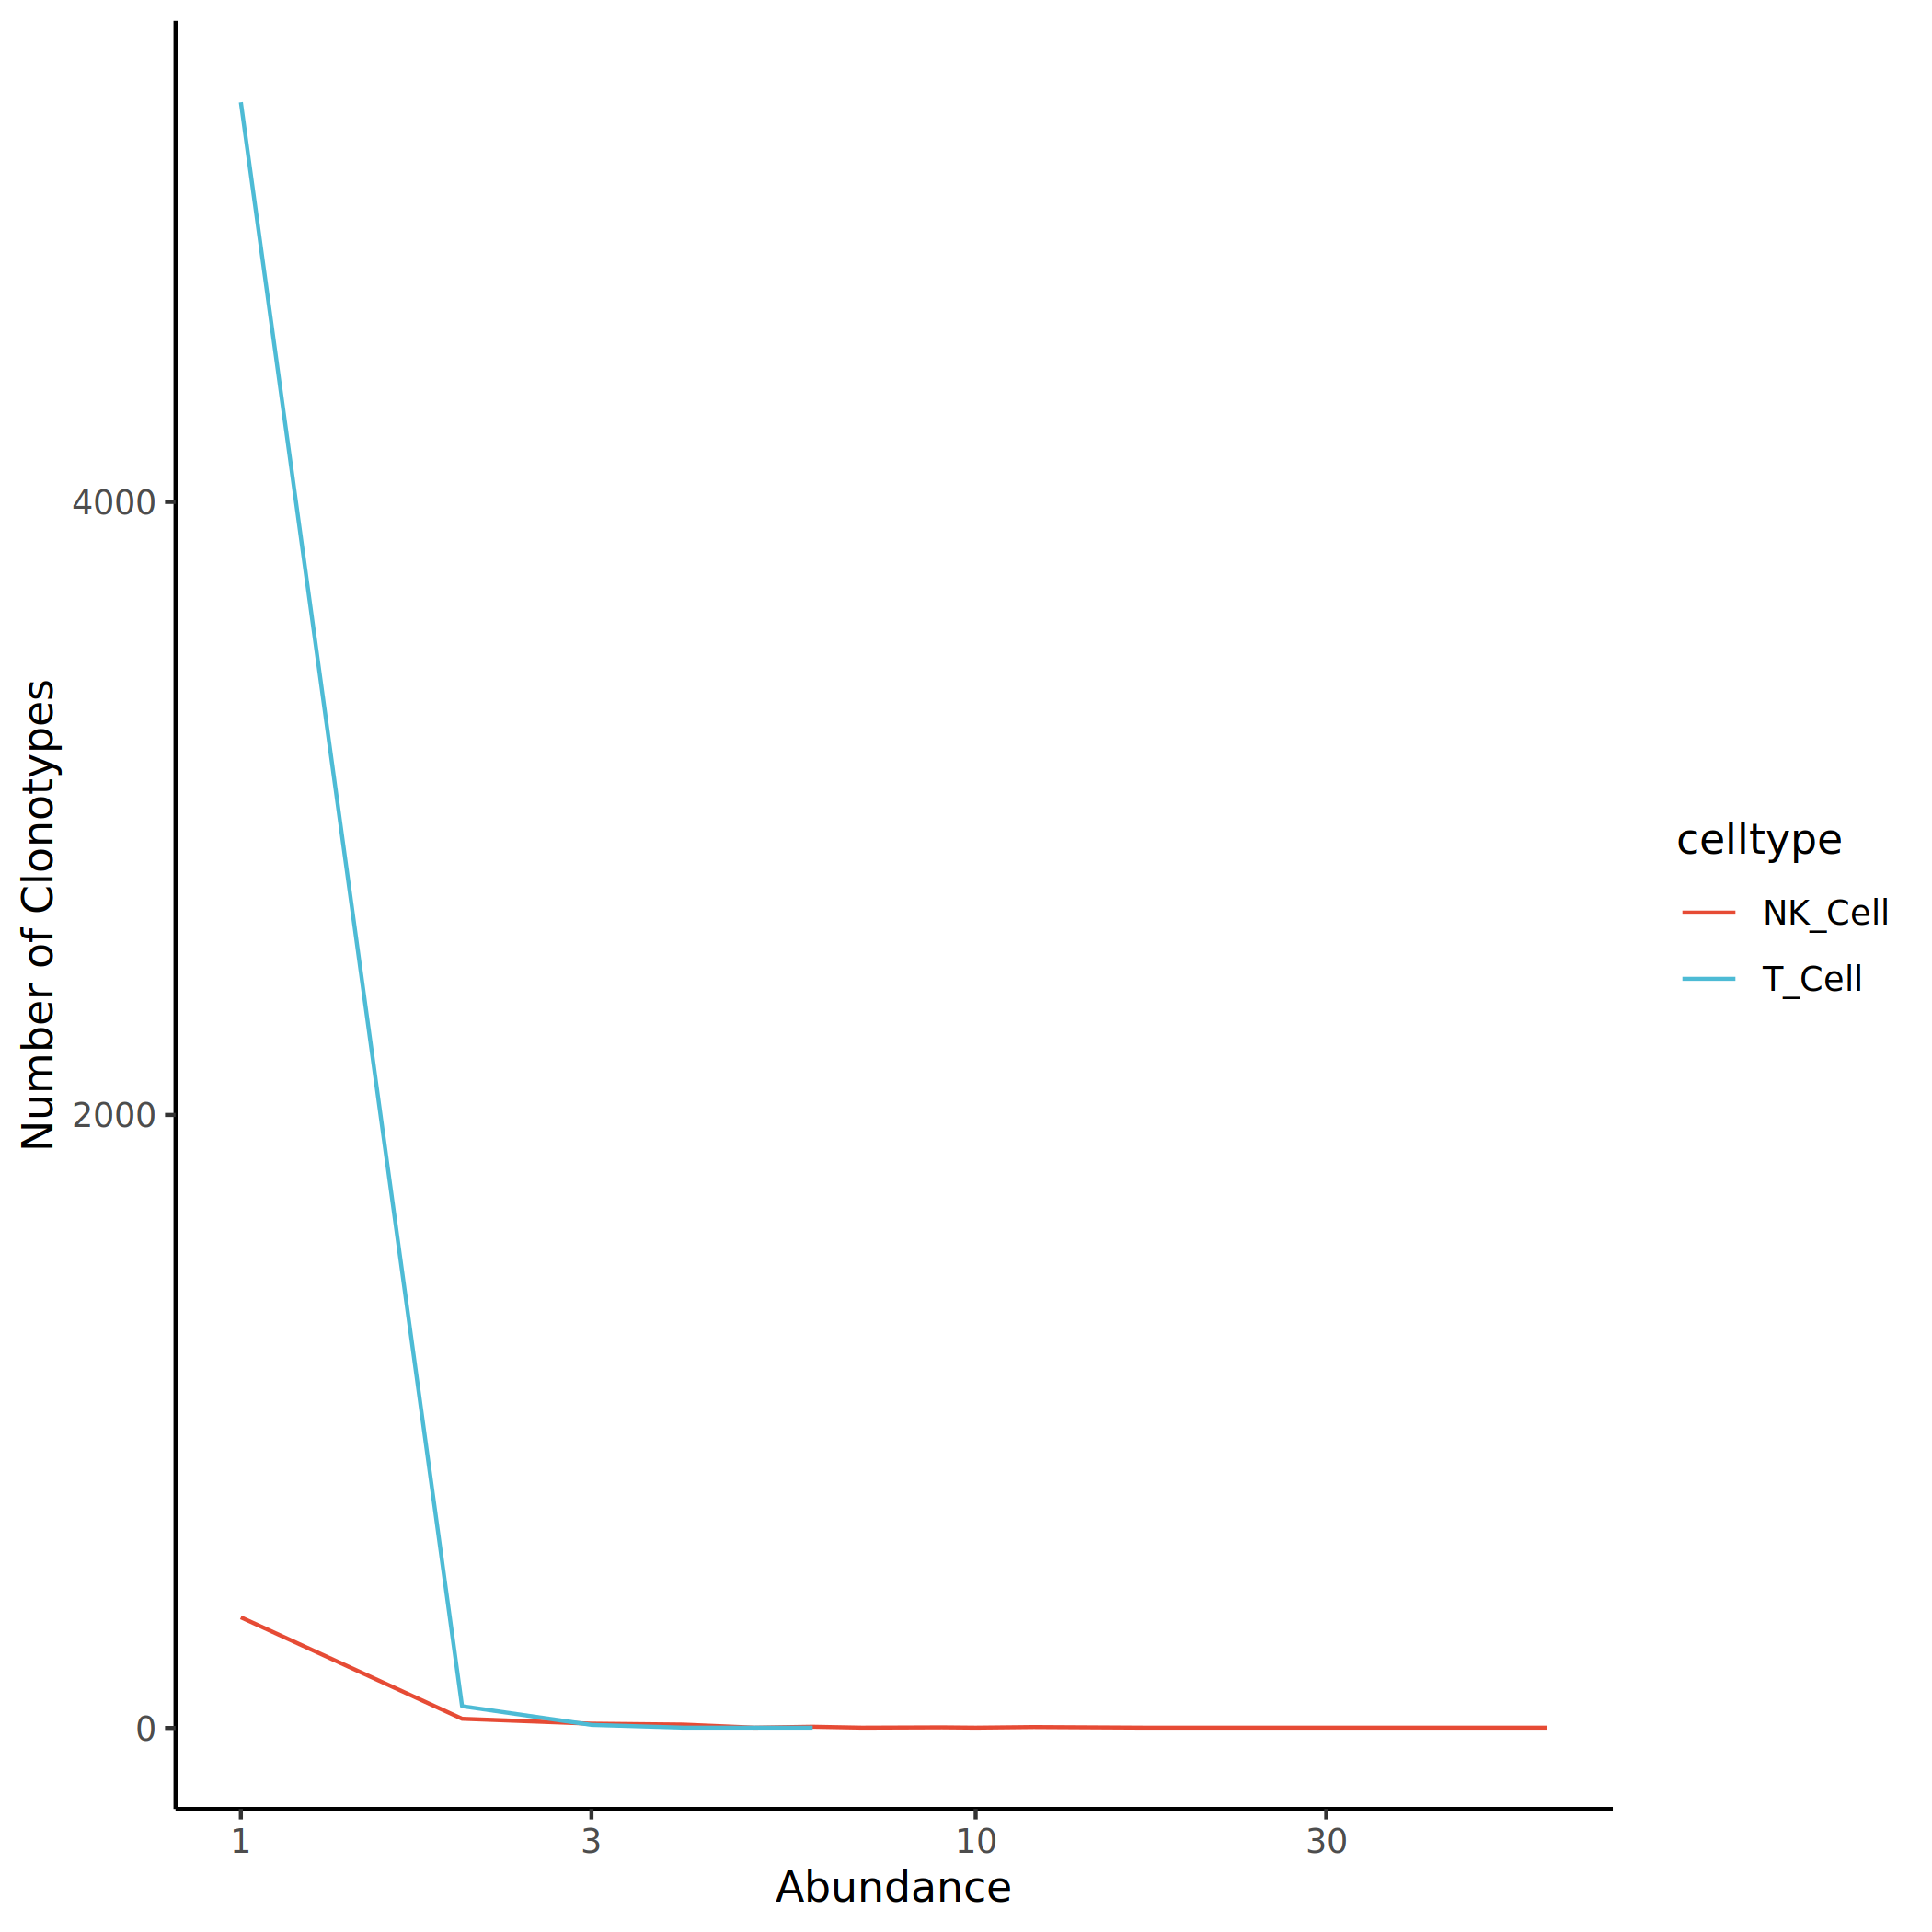
The figure above shows the clonotype abundance distribution of different cell populations. The abscissa represents clone size, and the ordinate represents the number of clonotypes. It can be seen from the figure that most clonotypes have small clone sizes (< 10), while a few clonotypes show high abundance, indicating the presence of clonal expansion phenomena.
Log2 Clone Abundance Distribution
To more clearly distinguish between non-clonal and clonal cell populations, clone abundance can be log2-transformed. The abscissa represents the log2 clone size of each clonotype, and the ordinate represents the number of clonotypes at that clone size. In the figure, clonotypes to the left of the auxiliary line x=1 have clone size < 2 (non-clonal), and clonotypes to the right have clone size ≥ 2 (clonal).
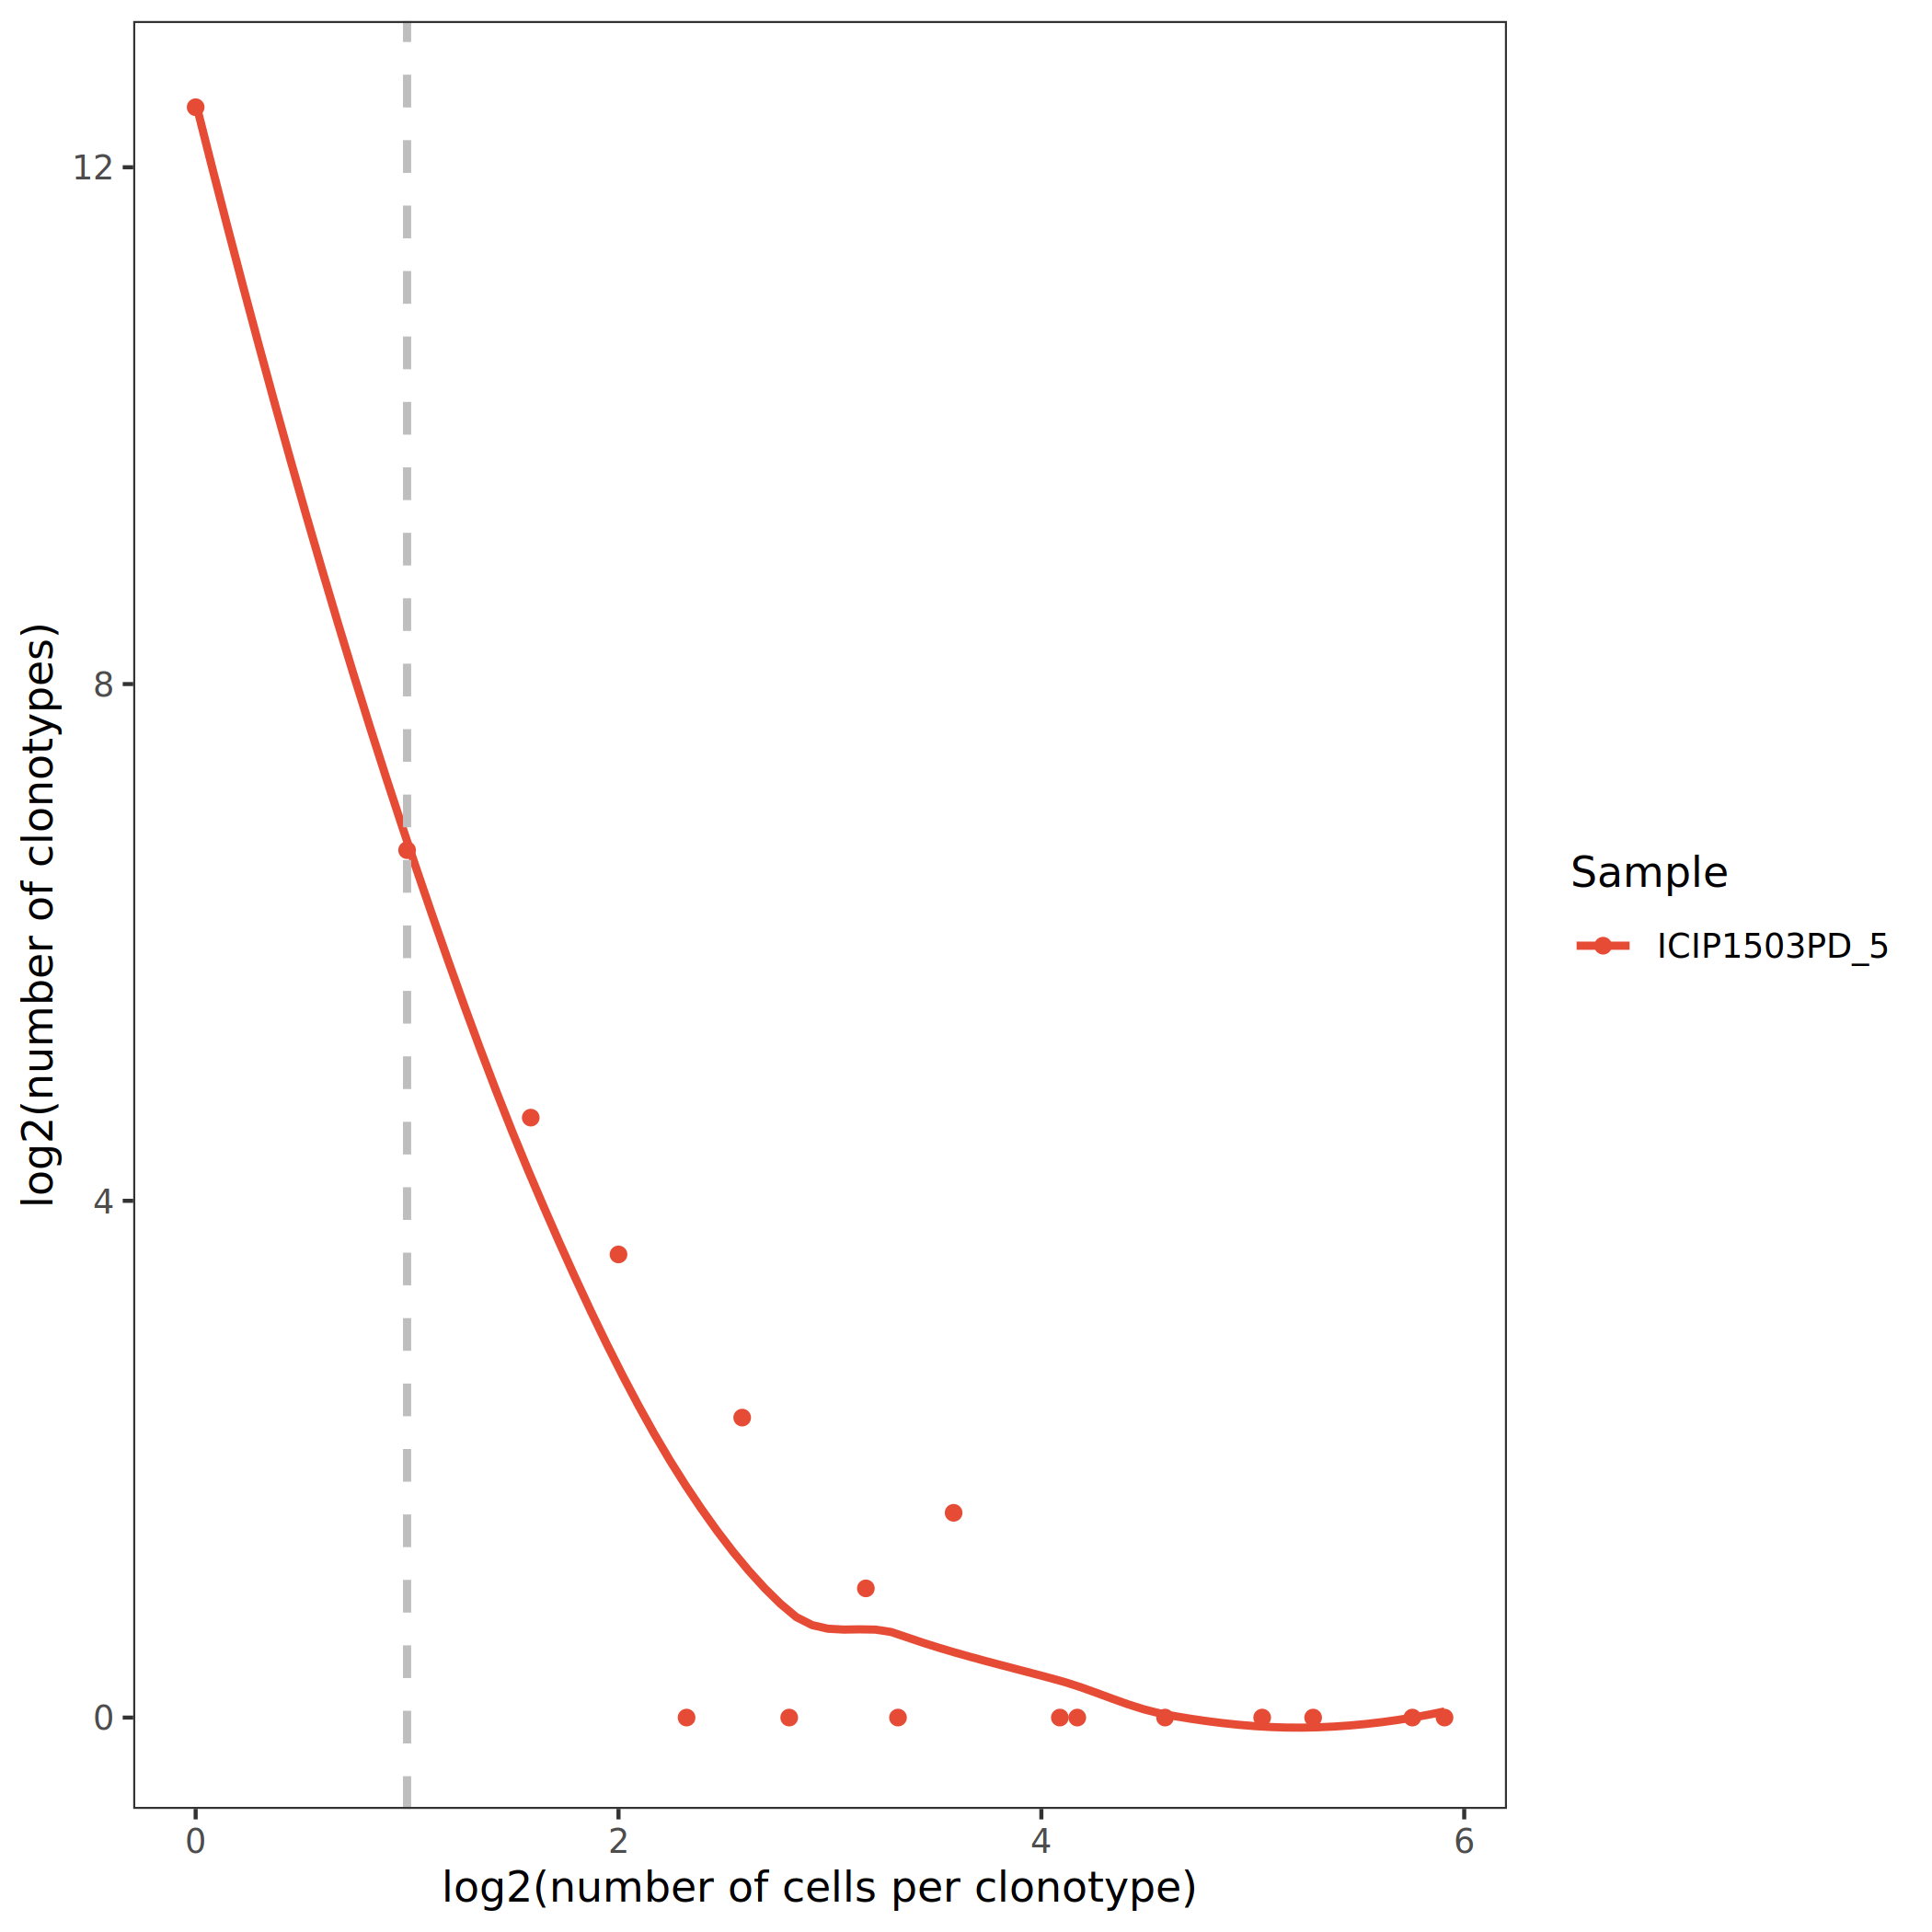
The figure above shows clone abundance distribution on a log2 scale. The auxiliary dashed line x=1 divides clonotypes into non-clonal (left) and clonal (right) parts. It can be observed that there is a certain proportion of clonally expanded cells (x>1) in the sample, which may be involved in specific immune responses.
TIP
Key Points for Result Interpretation:
- Clone abundance distribution presents a right-skewed feature, with a large number of low-abundance clones coexisting with a small number of high-abundance clones, which is consistent with the characteristics of a normal immunoglobulin repertoire.
- The proportion of clones with clone size ≥ 2 can reflect the degree of clonal expansion. A higher proportion indicates a more active immune response.
- The emergence of high-abundance clones may be related to specific antigen stimulation, chronic inflammation, or tumor microenvironment, requiring comprehensive analysis in combination with clinical background.
- Differences in clone abundance distribution among different cell subsets can reveal their different roles in immune responses.
Clonotype Proportion Analysis
Clonotype proportion analysis quantifies the degree of clonal expansion and the concentration of immune responses by assessing the proportion of high-abundance clonotypes in the immunoglobulin repertoire. This analysis helps identify dominant clonal populations and evaluate the clonal homeostasis of the immunoglobulin repertoire.
Top Clonotype Proportion Statistics
Perform proportion statistical analysis on the top10, top100, top1000, top3000, and top10000 clonotypes with the largest clone sizes in each sample (or specified group). By comparing the proportions of top clonotypes between different cell populations or samples, the expansion or contraction of clones can be reflected.
- High proportion of Top10 clones: Indicates oligoclonal dominance in the immune repertoire, where a few clonotypes dominate the immune response, common in acute infections, tumor-infiltrating lymphocytes (TILs), or autoimmune diseases.
- Low proportion of Top clones: Indicates that the immune repertoire maintains high diversity with relatively uniform clone distribution, characteristic of healthy individuals or naive immune states.
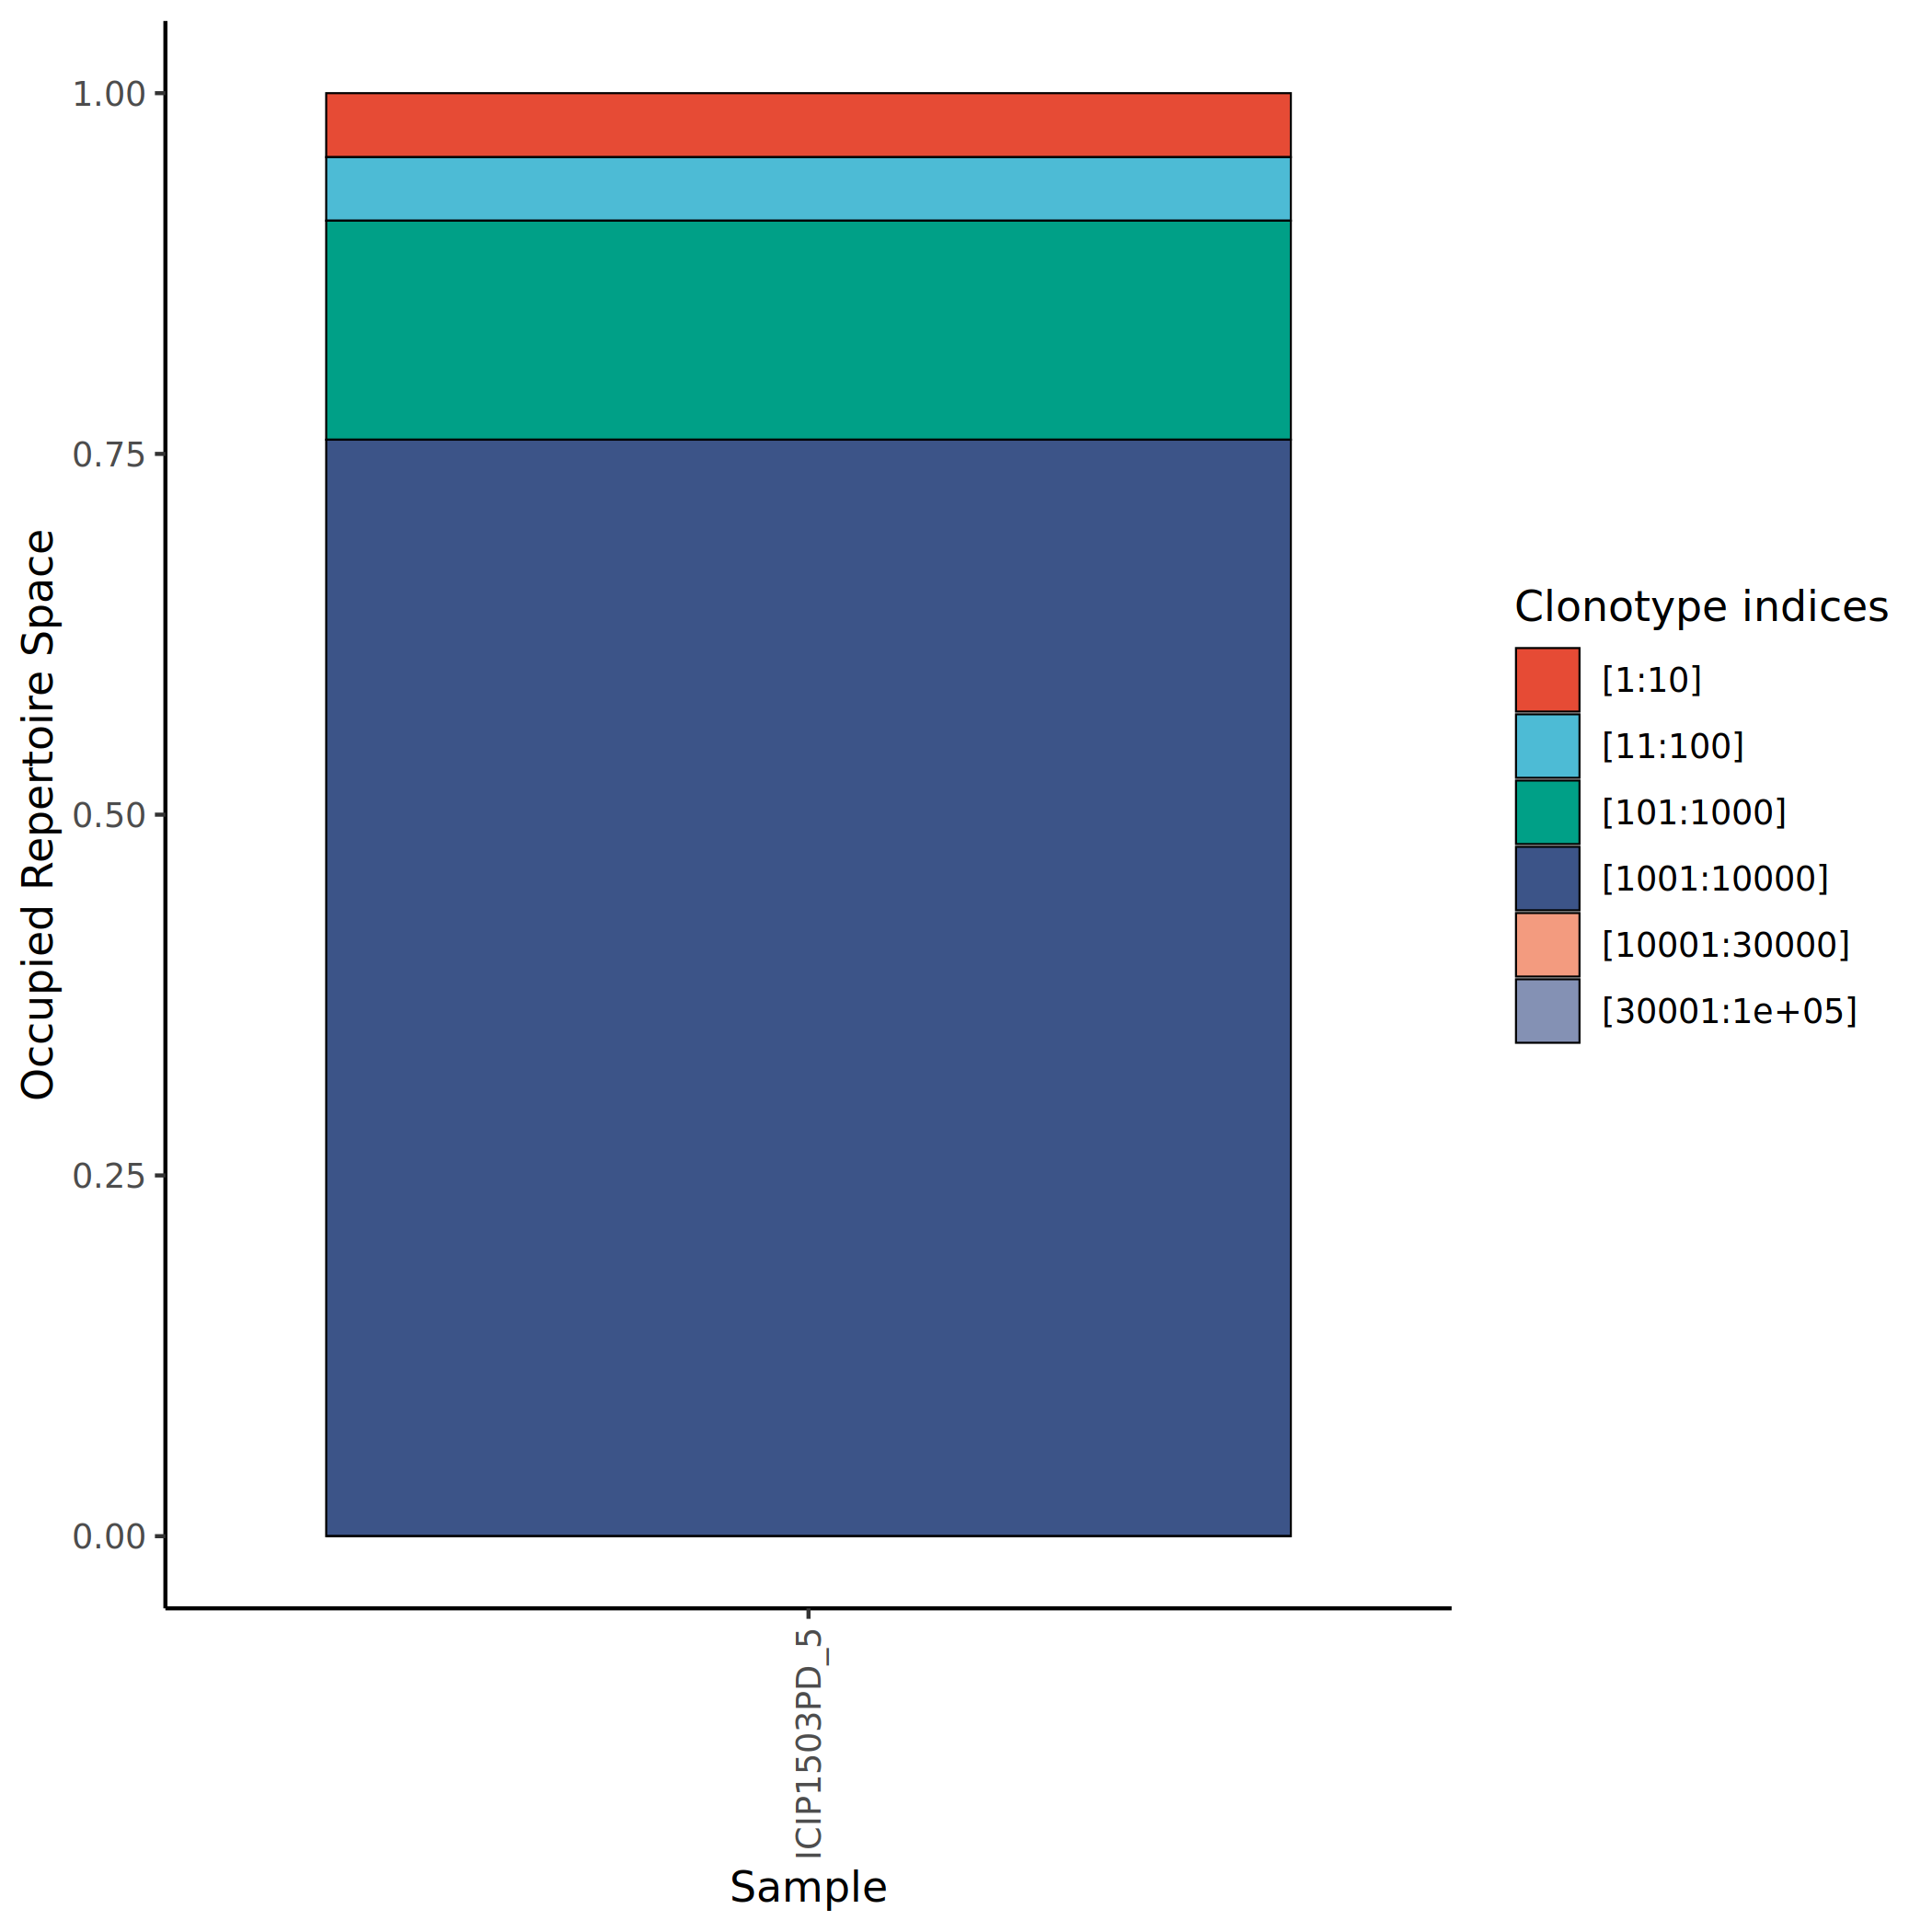
The figure above shows the proportion of top clonotypes in different samples. The x-axis represents sample names, and the y-axis represents proportion. Stacked bar charts of different colors represent the cumulative proportions of top10, top100, top1000, etc. clonotypes. By comparison, it can be found that some samples have a higher proportion of top10 clonotypes, indicating significant clonal expansion, while other samples maintain a relatively uniform clone distribution.
Clonal Homeostasis Analysis
Clonotypes are classified into five levels based on their proportion in the sample to assess clonal homeostasis of the immune repertoire:
- Rare: Clones with extremely low proportions, usually representing the diversity foundation of the immune repertoire.
- Small: Clones with relatively low proportions, possibly in the initial expansion phase or maintaining basic immune surveillance functions.
- Medium: Clones with moderate proportions, potentially involved in some degree of immune response.
- Large: Clones with relatively high proportions, indicating significant clonal expansion.
- Hyperexpanded: Clones with extremely high proportions, typically indicating strong antigen-specific immune responses.
The calculation method for clone proportion is: the clone size of a particular clone divided by the sum of clone sizes of all clones in the sample.
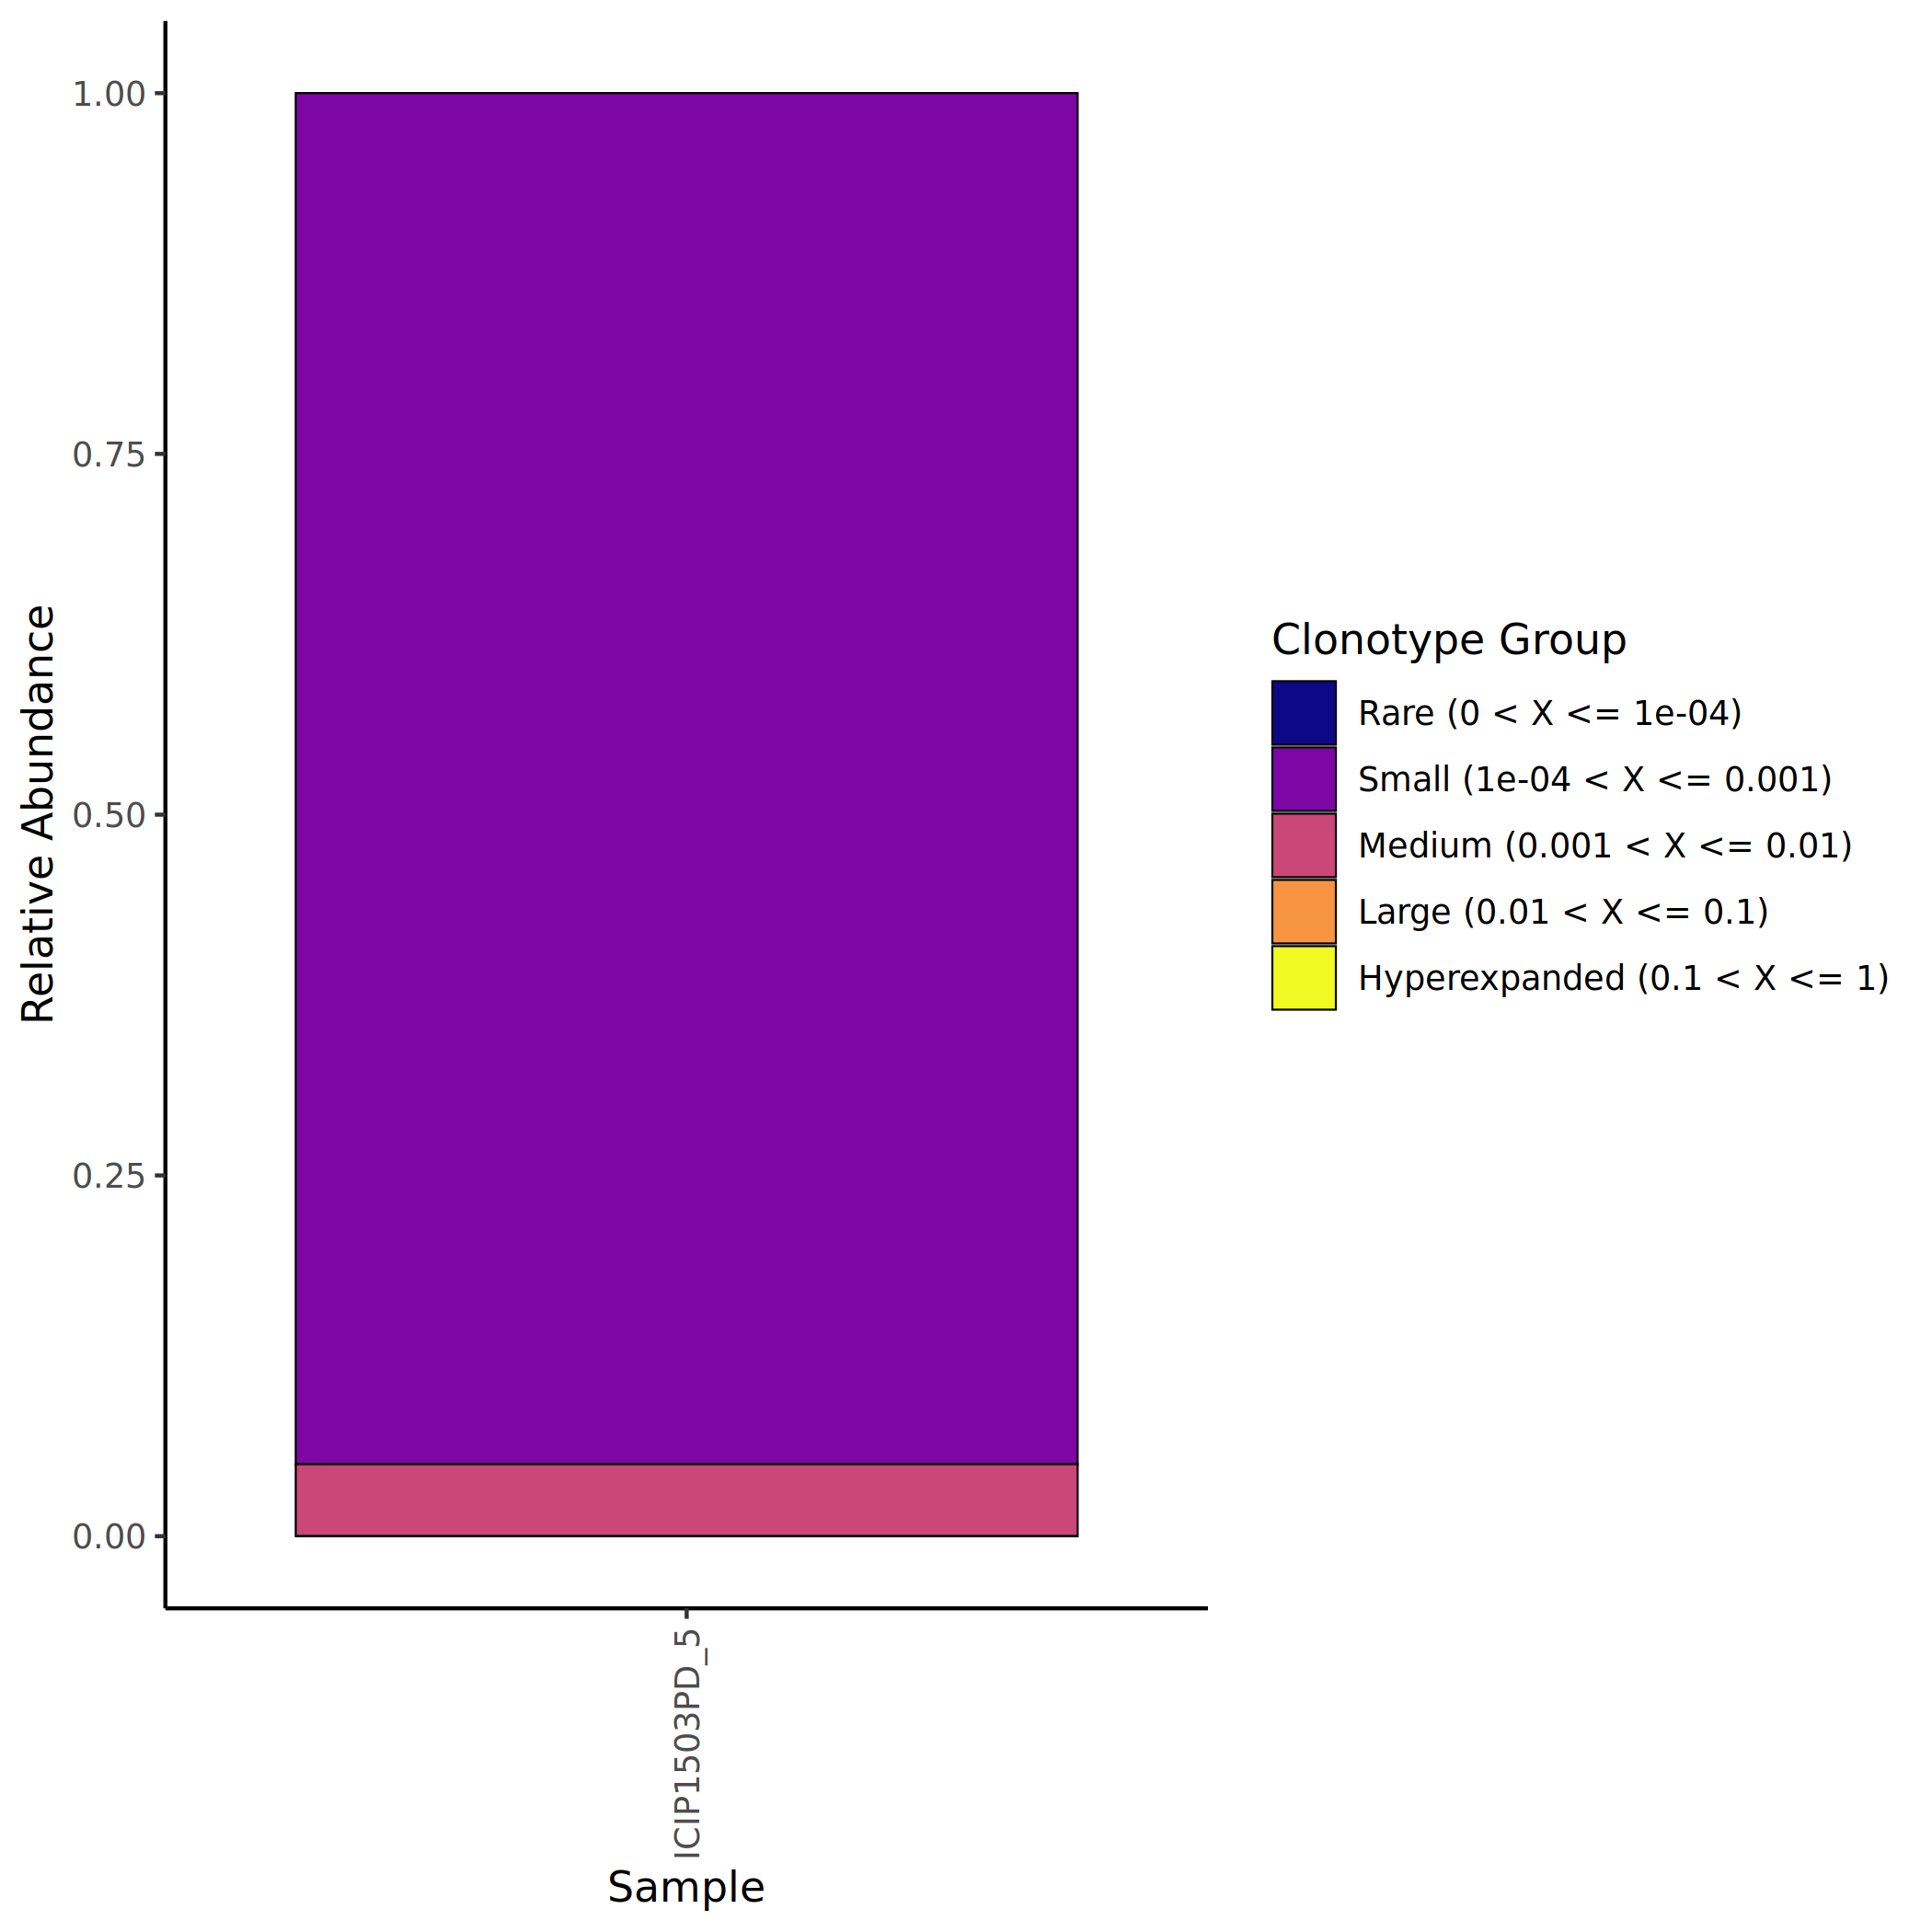
The figure above shows the proportion distribution of different clone levels in various samples. The x-axis represents sample names, and the y-axis represents proportion. Different colors represent different clone levels (Rare, Small, Medium, Large, Hyperexpanded). Healthy samples are usually dominated by Rare and Small clones, while in immune-activated states, the proportions of Large and Hyperexpanded clones significantly increase.
Clonotype Spatial Mapping
After grouping clonotypes by proportion, mapping them to transcriptomic UMAP plots can visualize the spatial distribution of different clone levels in cell populations, helping to identify cell subsets and tissue localization with clonal expansion.
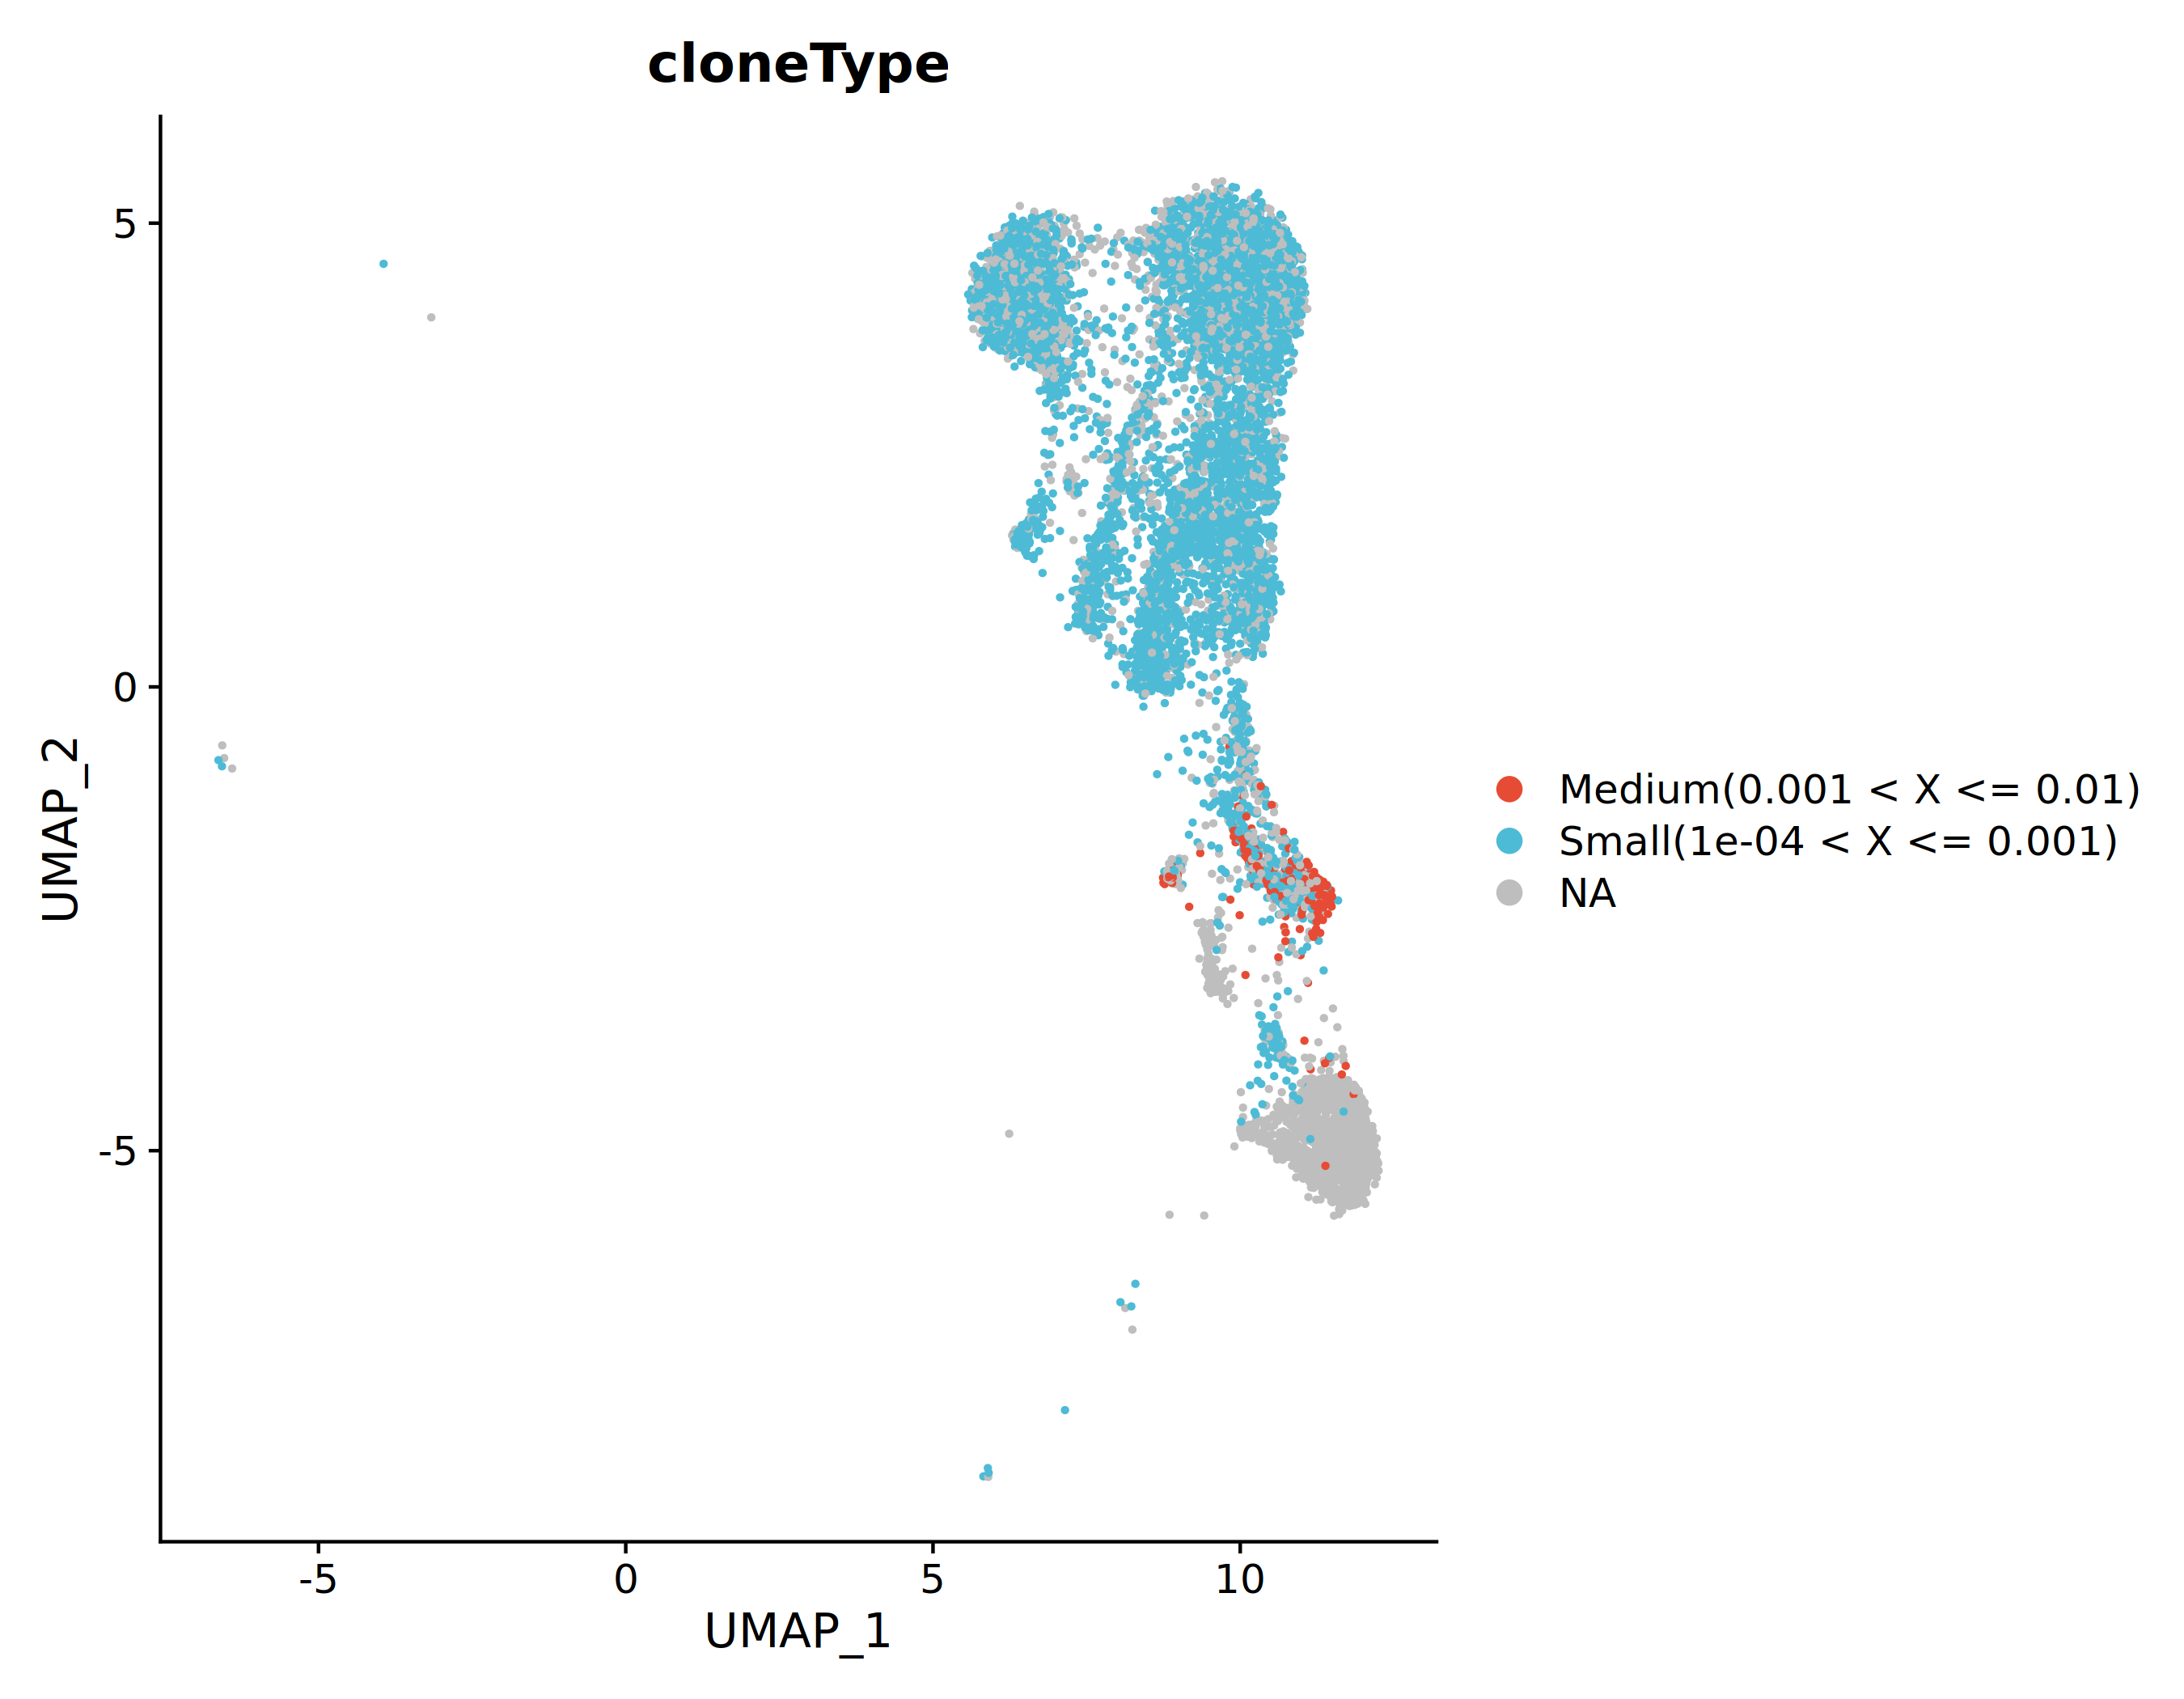
*The figure above maps cells of different clone levels into UMAP space. Different colors represent different clone levels. Hyperexpanded and Large clones tend to cluster in specific cell subset regions, suggesting these subsets may have undergone specific clonal expansion.
In addition, the top 5 clones with the highest proportions can be individually mapped to UMAP plots for more precise localization of dominant clones' distribution.
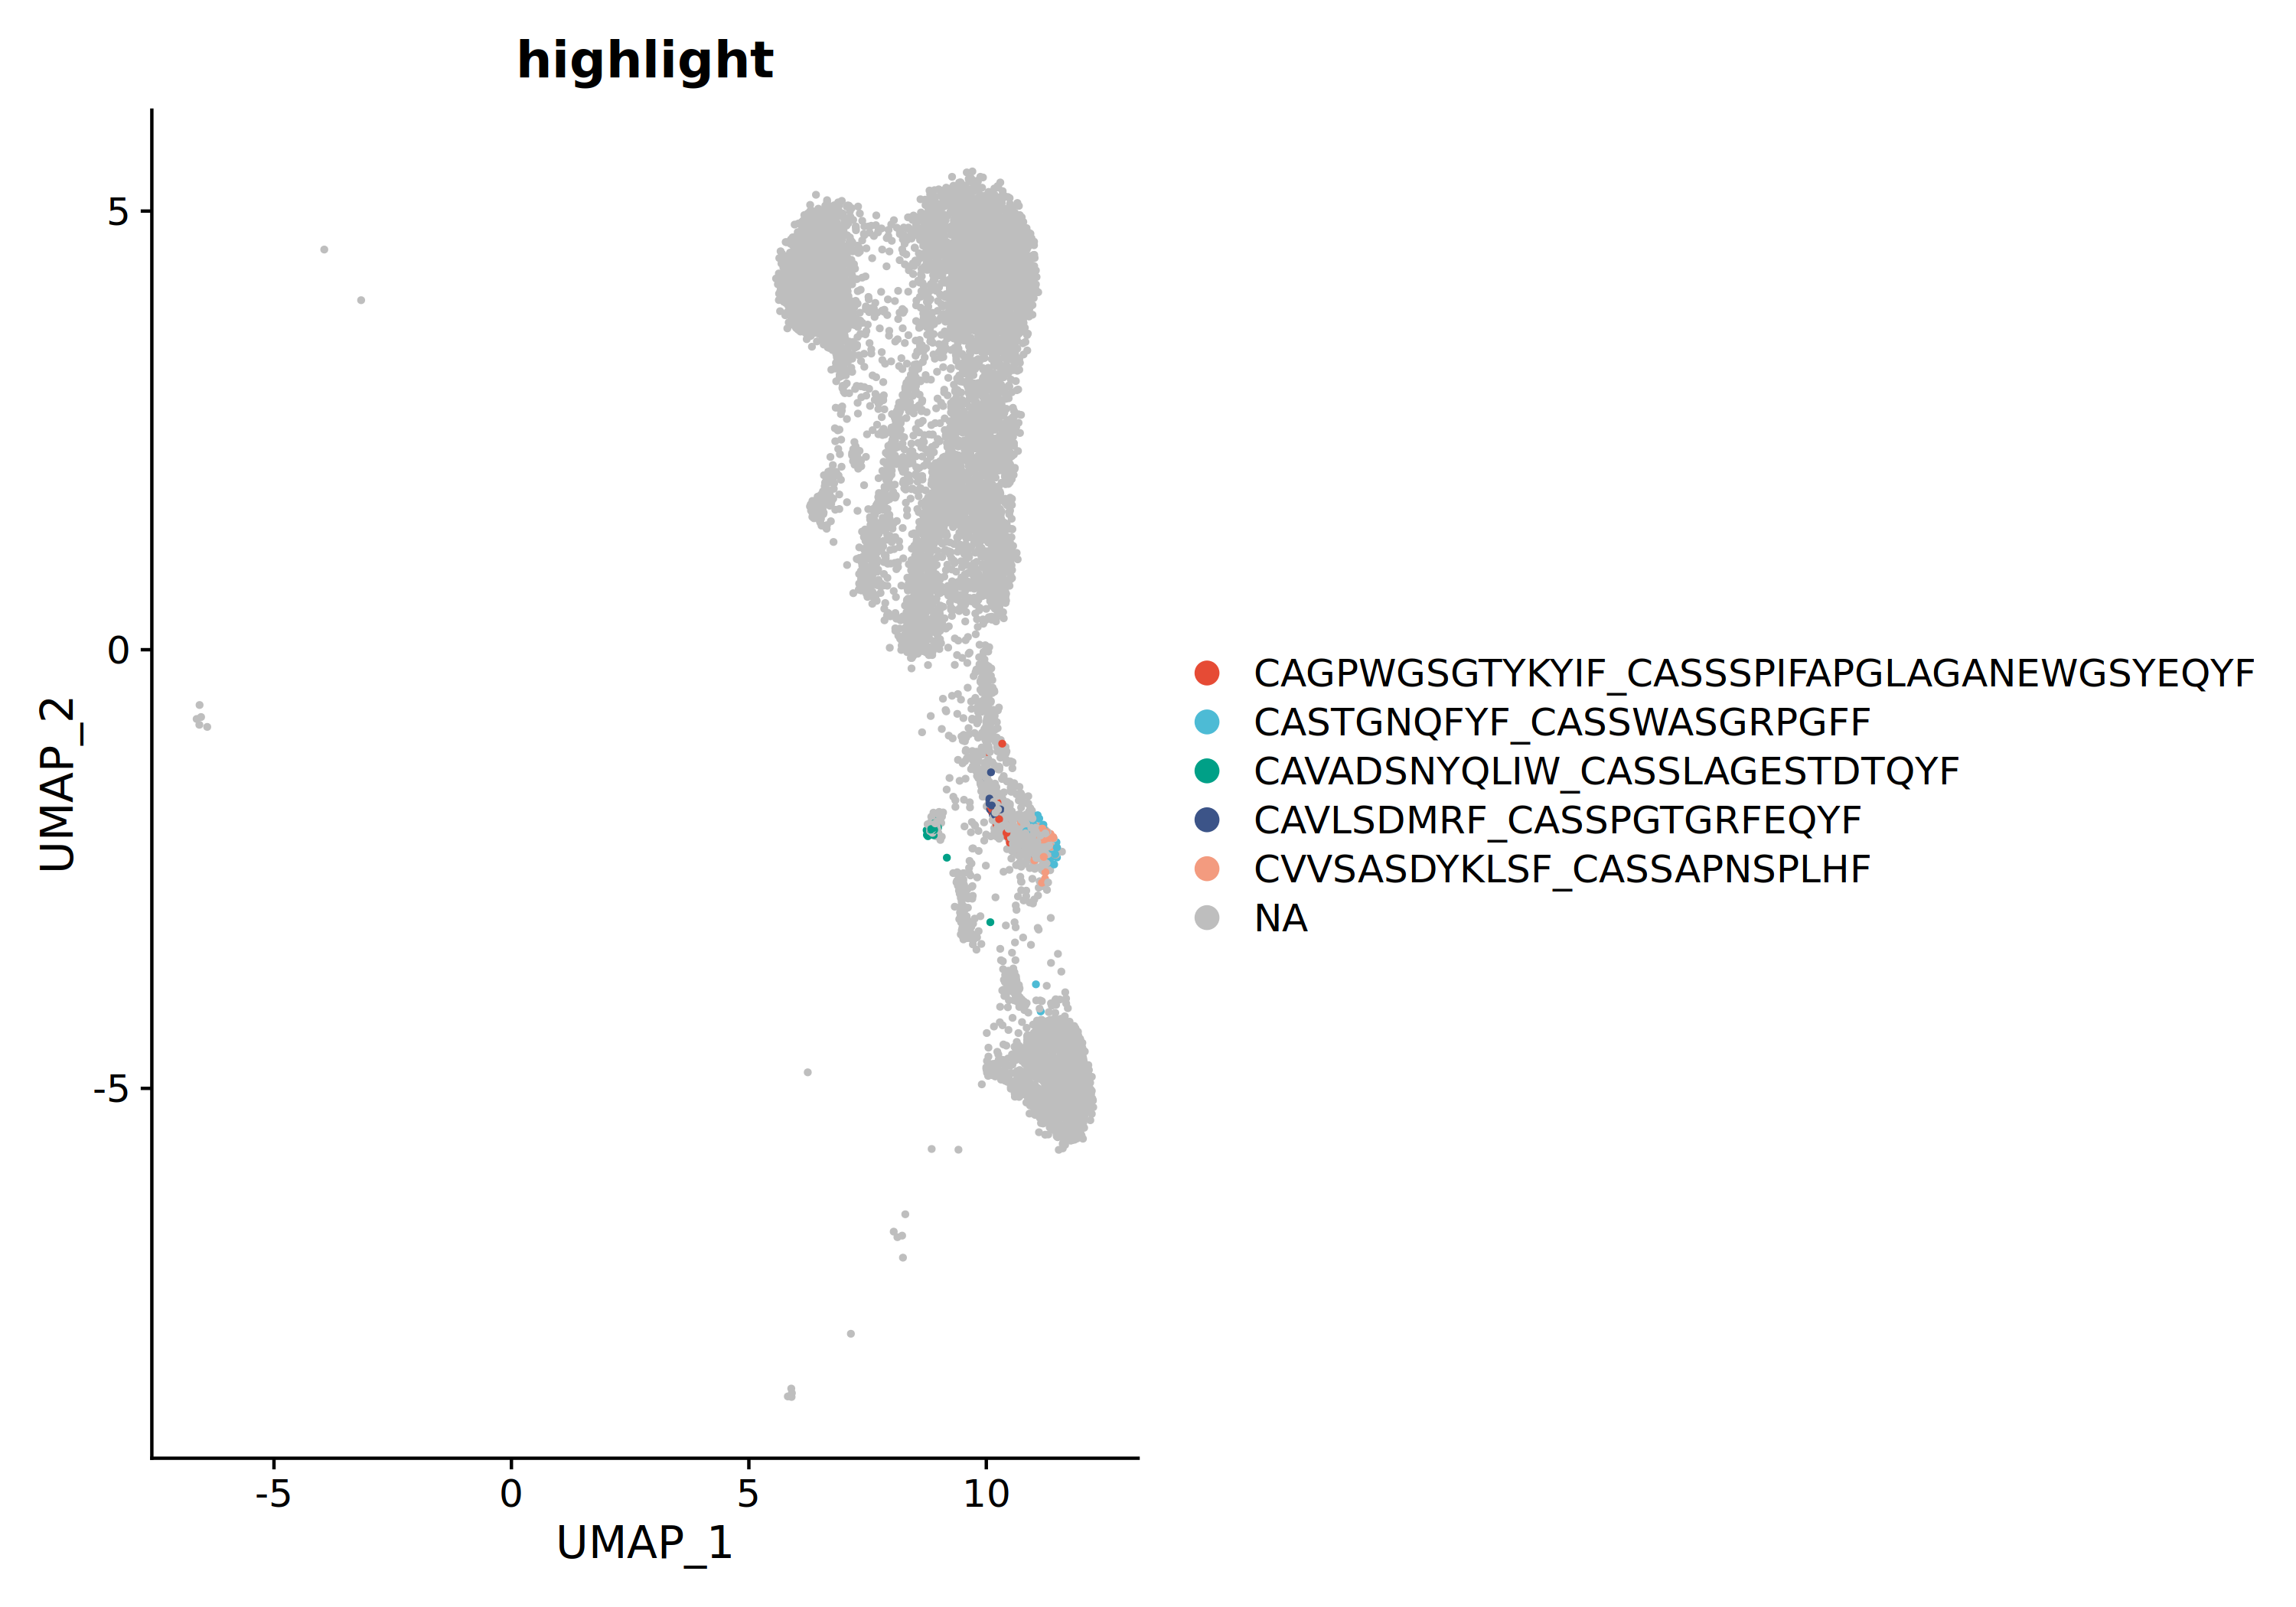
*The figure above shows the distribution of the top 5 clonotypes with the highest proportions in UMAP space. Each clonotype is marked with a different color. Through observation, it can be found that dominant clones may concentrate in specific cell clusters, reflecting clone-specific functional states and tissue homing properties.
TIP
Key Points for Result Interpretation:
- Top clonotype proportions can quantify the concentration of the immune repertoire. High proportions indicate oligoclonal dominance, while low proportions indicate maintained diversity.
- Clonal homeostasis analysis helps assess the activation state of the immune system. Increases in Hyperexpanded clones are typically associated with specific immune responses.
- The spatial distribution of clonotypes can reveal associations between clonal expansion and cell subsets/tissue microenvironments, providing clues for understanding the spatiotemporal dynamics of immune responses.
- Comparing clone proportion changes between different samples or before and after treatment can evaluate treatment efficacy or disease progression.
Clonotype Sankey Diagram Analysis
Clonotype Sankey Diagrams, also known as Alluvial Plots, are a type of flowchart visualization tool that shows data flow and distribution patterns by connecting nodes at different levels. In immune repertoire analysis, Sankey diagrams can intuitively display the distribution relationships and dynamic changes of clonotypes between different samples and cell populations, helping to identify clonotype migration, expansion, or contraction patterns.
Biological Significance of Clonotype Sankey Diagrams
In single-cell immune repertoire analysis, the same clonotype may be distributed across different cell subsets or different samples/groups. Through Sankey diagrams, the distribution trajectory of specific clonotypes can be traced to:
- Reveal clonotype cell population attribution: Understand which cell subsets a clonotype primarily distributes in, reflecting its functional characteristics and differentiation state.
- Identify shared clones: Discover clonotypes shared among multiple cell populations or samples, suggesting these clones may have broad antigen reactivity or migration capabilities.
- Track clonal dynamic changes: In time-series or pre/post-treatment samples, track expansion or contraction trends of clonotypes to evaluate dynamic evolution of immune responses.
- Discover distribution patterns of dominant clones: The distribution of high-abundance clonotypes across different cell populations can suggest their central role in immune responses.
Sample-Cell Population-Clonotype Sankey Diagram
Connecting three levels—samples (or groups), cell populations, and clonotypes—can comprehensively show the distribution of each cell population in each sample and the composition information of various clonotypes in each cell population. The width of flow bands in the diagram represents the abundance (cell count) of the corresponding clonotype.
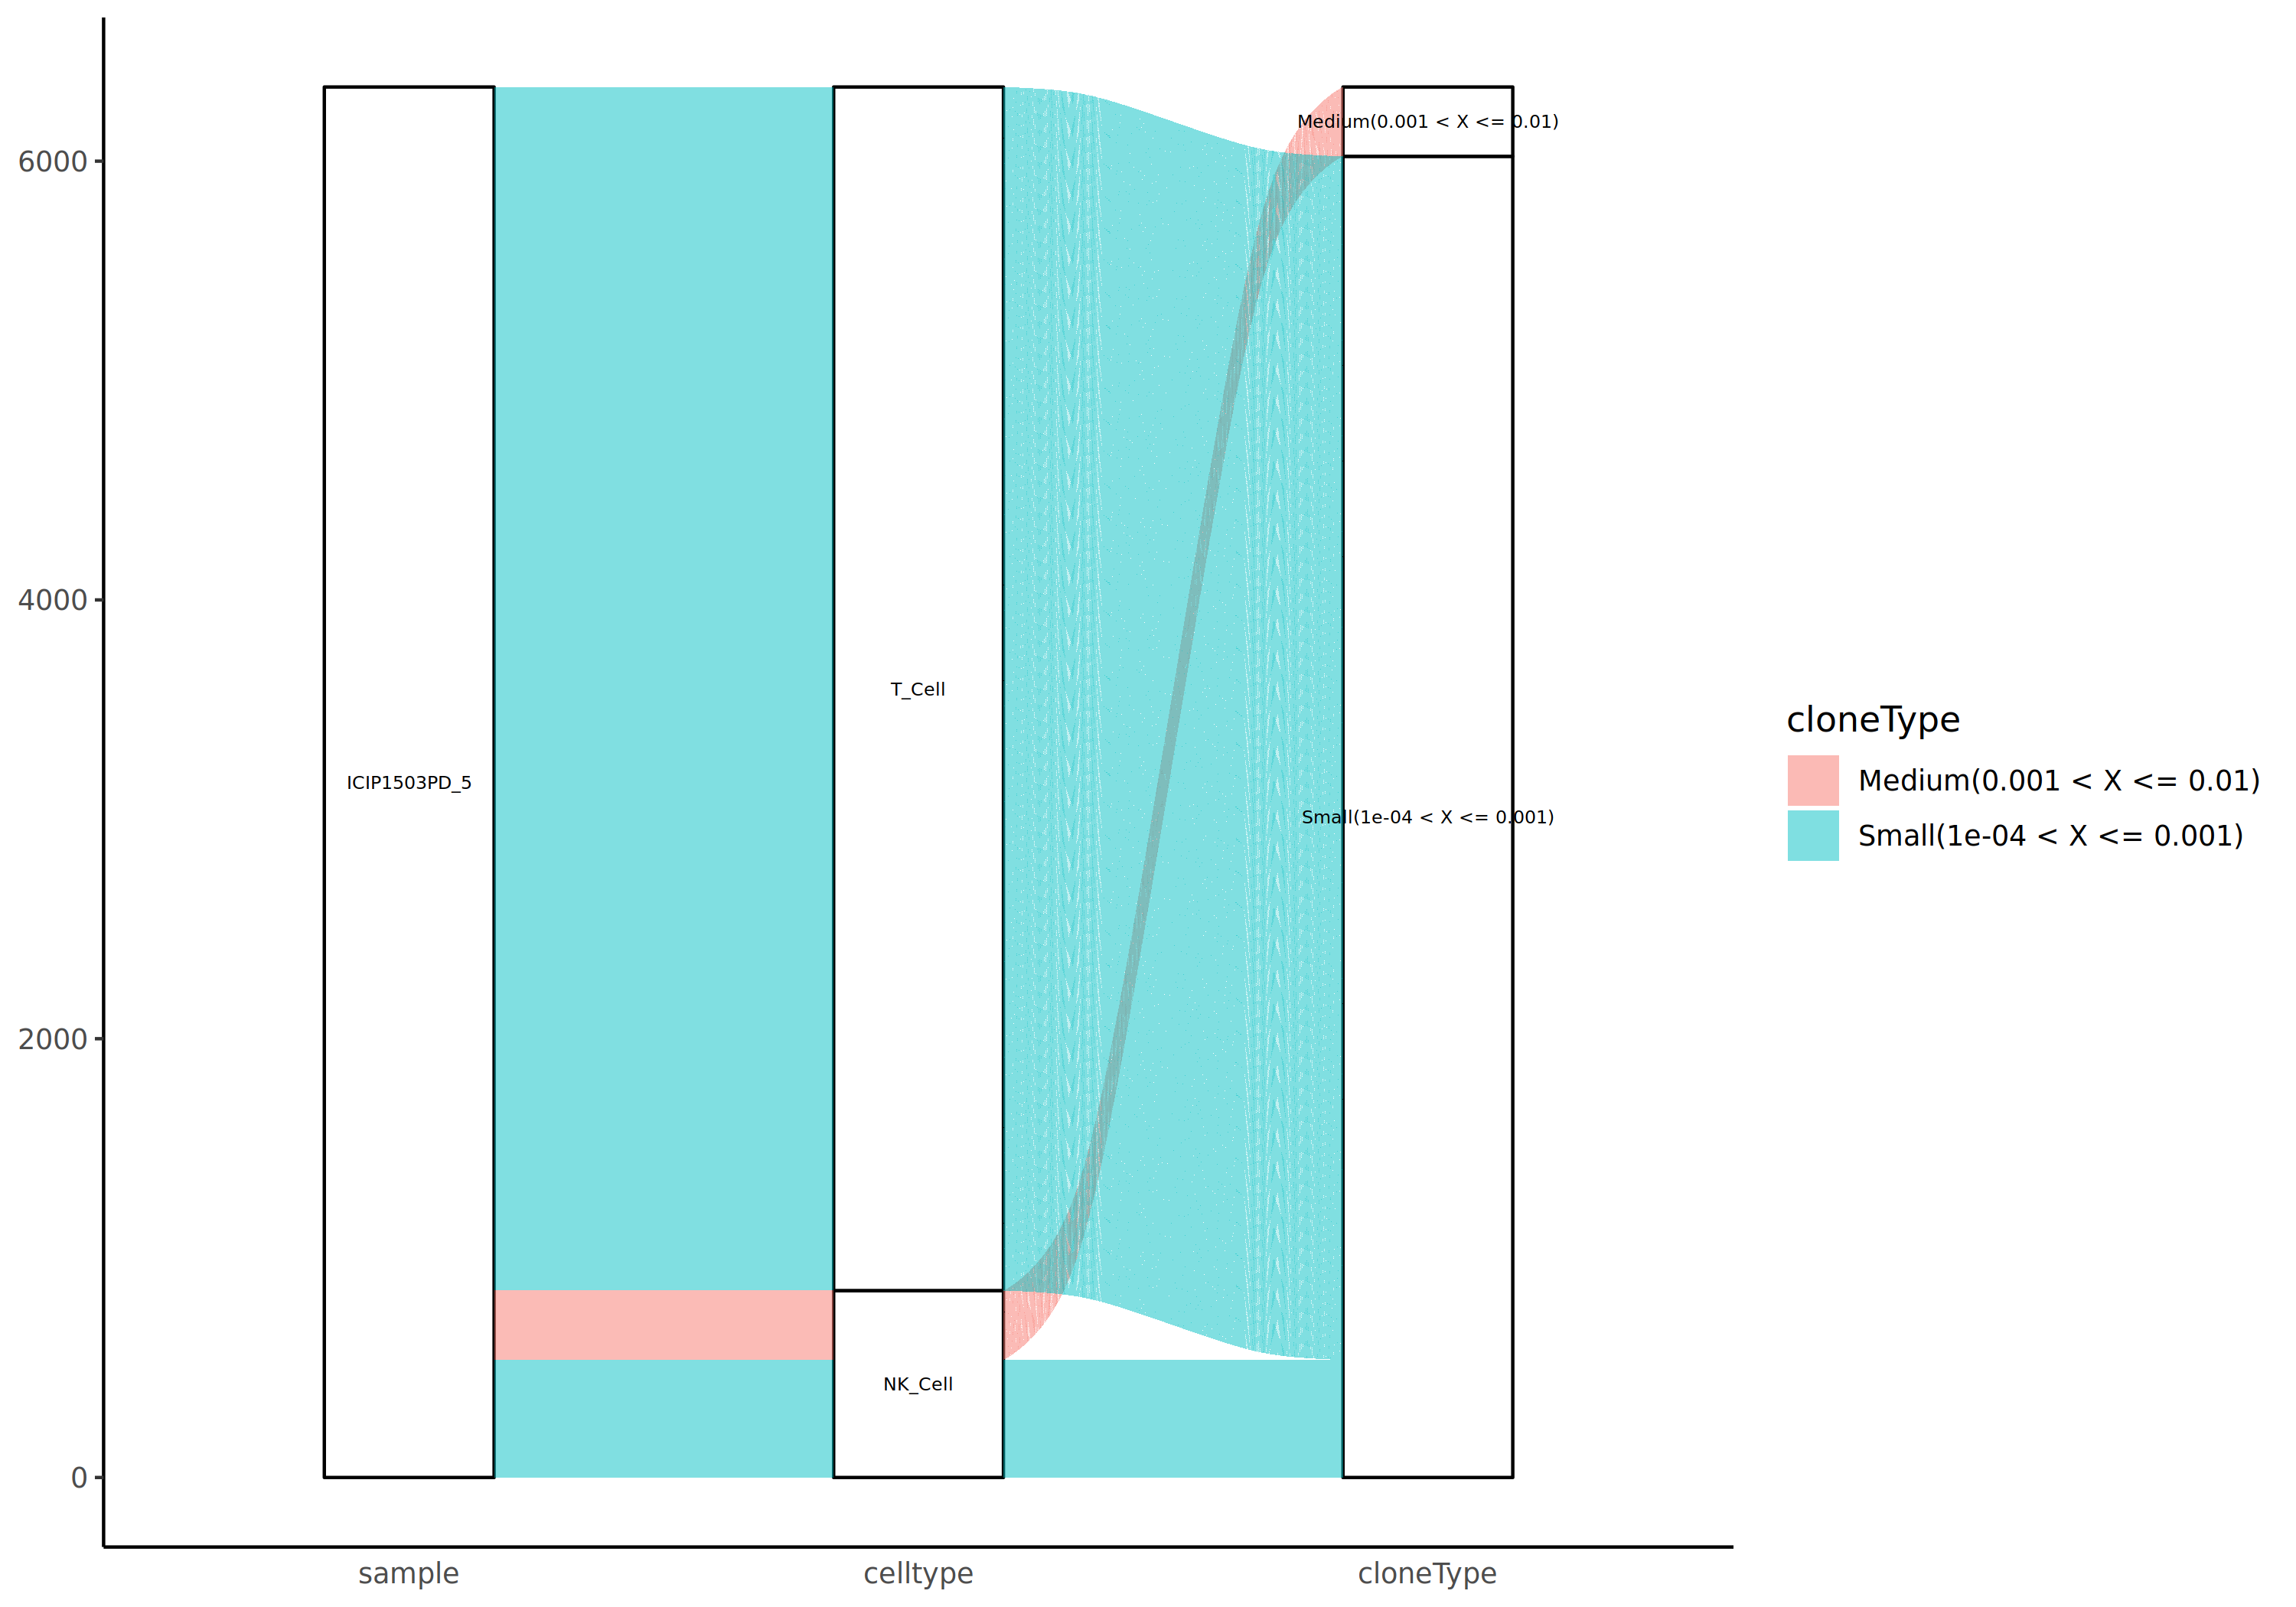
*The figure above shows a three-level Sankey diagram from samples to cell populations to clonotypes. The left side represents samples or groups, the middle represents cell subsets, and the right side represents clonotype classifications. The width of flow bands indicates cell count, and colors distinguish different categories. Through this diagram, we can observe: (1) the proportion of different cell populations in each sample; (2) the distribution of clonotypes in each cell population; (3) some clonotypes may be distributed across multiple cell populations, suggesting they may be multifunctional or in different differentiation stages.
Top5 Clonotype Sankey Diagram Comparison Analysis
To more precisely study the proportion and flow of dominant clonotypes between different cell populations, the top 5 clonotypes with the highest proportions in each cell population can be extracted, and their changing trends and distribution patterns between cell populations can be intuitively displayed through Sankey diagrams.
- Clonal specific distribution: Some clonotypes are only enriched in specific cell populations, with flow bands concentrated in a single cell population, suggesting functional specificity.
- Cross-population clonal flow: The flow bands of some clonotypes span multiple cell populations, indicating the clone is distributed across different cell subsets, possibly representing cells with multiple functions or in transitional differentiation states.
- Clonal abundance changes: The width of flow bands reflects differences in clonotype abundance across cell populations, enabling identification of expansion or contraction trends.
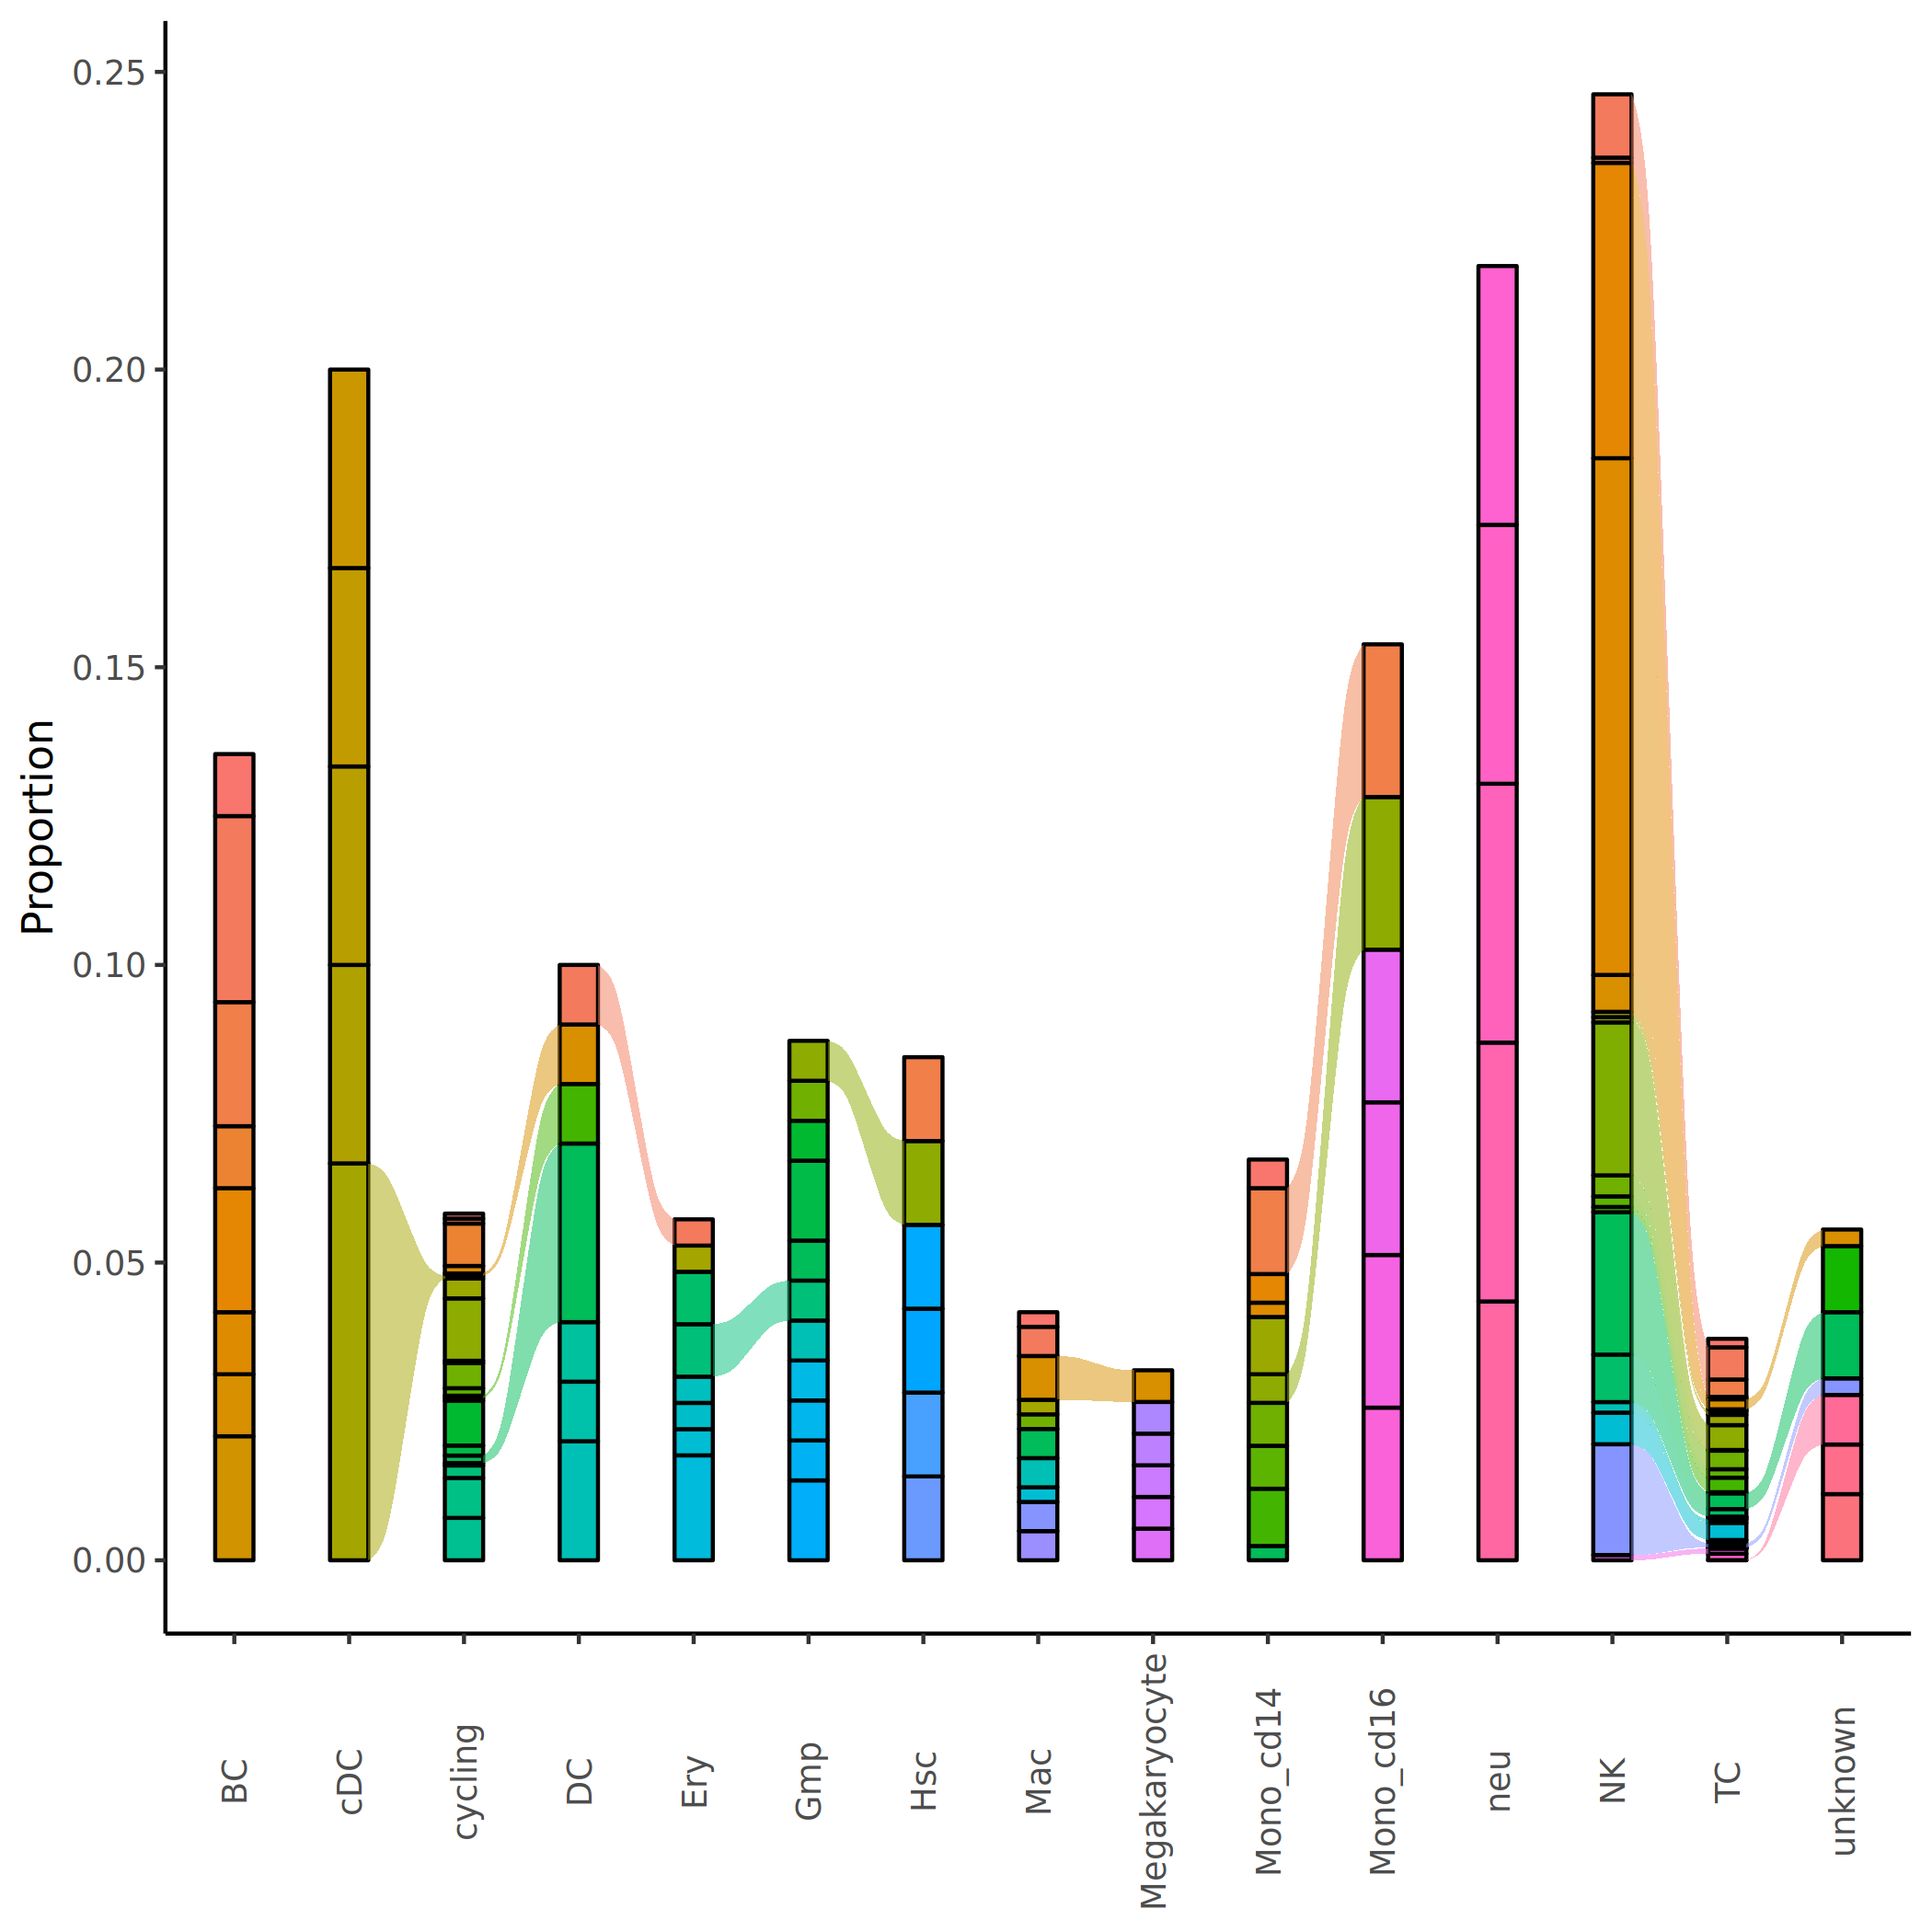
*The figure above shows the distribution and flow of Top5 clonotypes in various cell populations in Sankey diagram form. The Top5 clonotypes of each cell population are represented by flow bands of different colors, with the width of the flow bands reflecting the abundance of the clonotype in that cell population. Through this diagram, we can intuitively observe: (1) the composition of Top5 clonotypes in each cell population; (2) the flow and proportion changes of some high-abundance clonotypes across multiple cell populations (same color flow bands); (3) the clonal dominance characteristics and specificity of different cell populations, as well as clonotype migration patterns between cell populations.
Longitudinal Tracking and Dynamic Analysis
If the research design includes patient information or time-series data, Sankey diagrams can be further used to analyze dynamic changes in clonotypes in the same patient at different time points or different tissue sites. This longitudinal tracking analysis is valuable in the following scenarios:
- Treatment response assessment: By comparing changes in clonotype composition and abundance before and after treatment, treatment efficacy can be intuitively evaluated. Effective treatment usually leads to regression or contraction of specific pathological clones.
- Disease progression monitoring: Tracking the expansion, contraction, or disappearance of specific clonotypes at different time points helps assess changes in disease status and predict disease outcomes.
- Tissue homing and migration studies: Comparing clonotype composition between peripheral blood and tissue-infiltrating cells can reveal T/B cell migration trajectories and tissue localization patterns, helping to understand the spatial distribution characteristics of immune cells.
TIP
Key Points for Result Interpretation:
- The width of flow bands in Sankey diagrams represents clonal abundance; wider bands indicate more cells in the clone.
- Clonotypes spanning multiple cell populations may be multifunctional or represent transitional cell populations.
- Clonotypes highly concentrated in a single cell population suggest functional specificity and terminal differentiation state.
- By comparing Sankey diagrams from different samples or time points, clonal expansion, contraction, or cell population transition events can be identified.
- Distribution patterns of dominant clones can indicate the dominant direction of immune responses and key cell subsets.
Shared and Unique Clonotype Analysis
Shared and unique clonotype analysis is an important method for assessing similarities and differences in clonotype composition between different cell populations or samples. This analysis helps identify cell population-specific clonotypes and clonotypes shared across multiple cell populations or samples, thereby revealing the breadth and specificity of immune responses.
Biological Significance
- Unique Clones: Clonotypes that appear only in a single cell population or sample, representing the specific immune response or unique antigen recognition capability of that cell population. The proportion of unique clones reflects the immunological independence of the cell population.
- Shared Clones: Clonotypes that exist in two or more cell populations/samples, suggesting these clones may:
- Recognize common antigen epitopes
- Undergo migration or differentiation transitions between cell populations
- Represent memory or long-lived immune responses
- Clone Overlap: Measures the similarity of clonotype composition between different cell populations or samples, assessing the aggregation or dispersion of immune repertoires.
UpSet Plot for Shared Clones
When comparing clonotype intersections among three or more cell populations or samples, traditional Venn Diagrams become complex and difficult to read. UpSet plots are a clearer visualization method, particularly suitable for intersection analysis of multiple sets.
Components of an UpSet plot:
- Horizontal bar chart on the left: Shows the total number of clonotypes in each cell population (Set Size), reflecting clonal diversity of each population.
- Matrix plot at the bottom: Uses points and lines to represent cell population combinations. A single point represents unique clones, while multiple connected points represent shared clones.
- Vertical bar chart above: Displays the number of clonotypes in each combination (unique or shared) (Intersection Size), with bar height representing clone count.
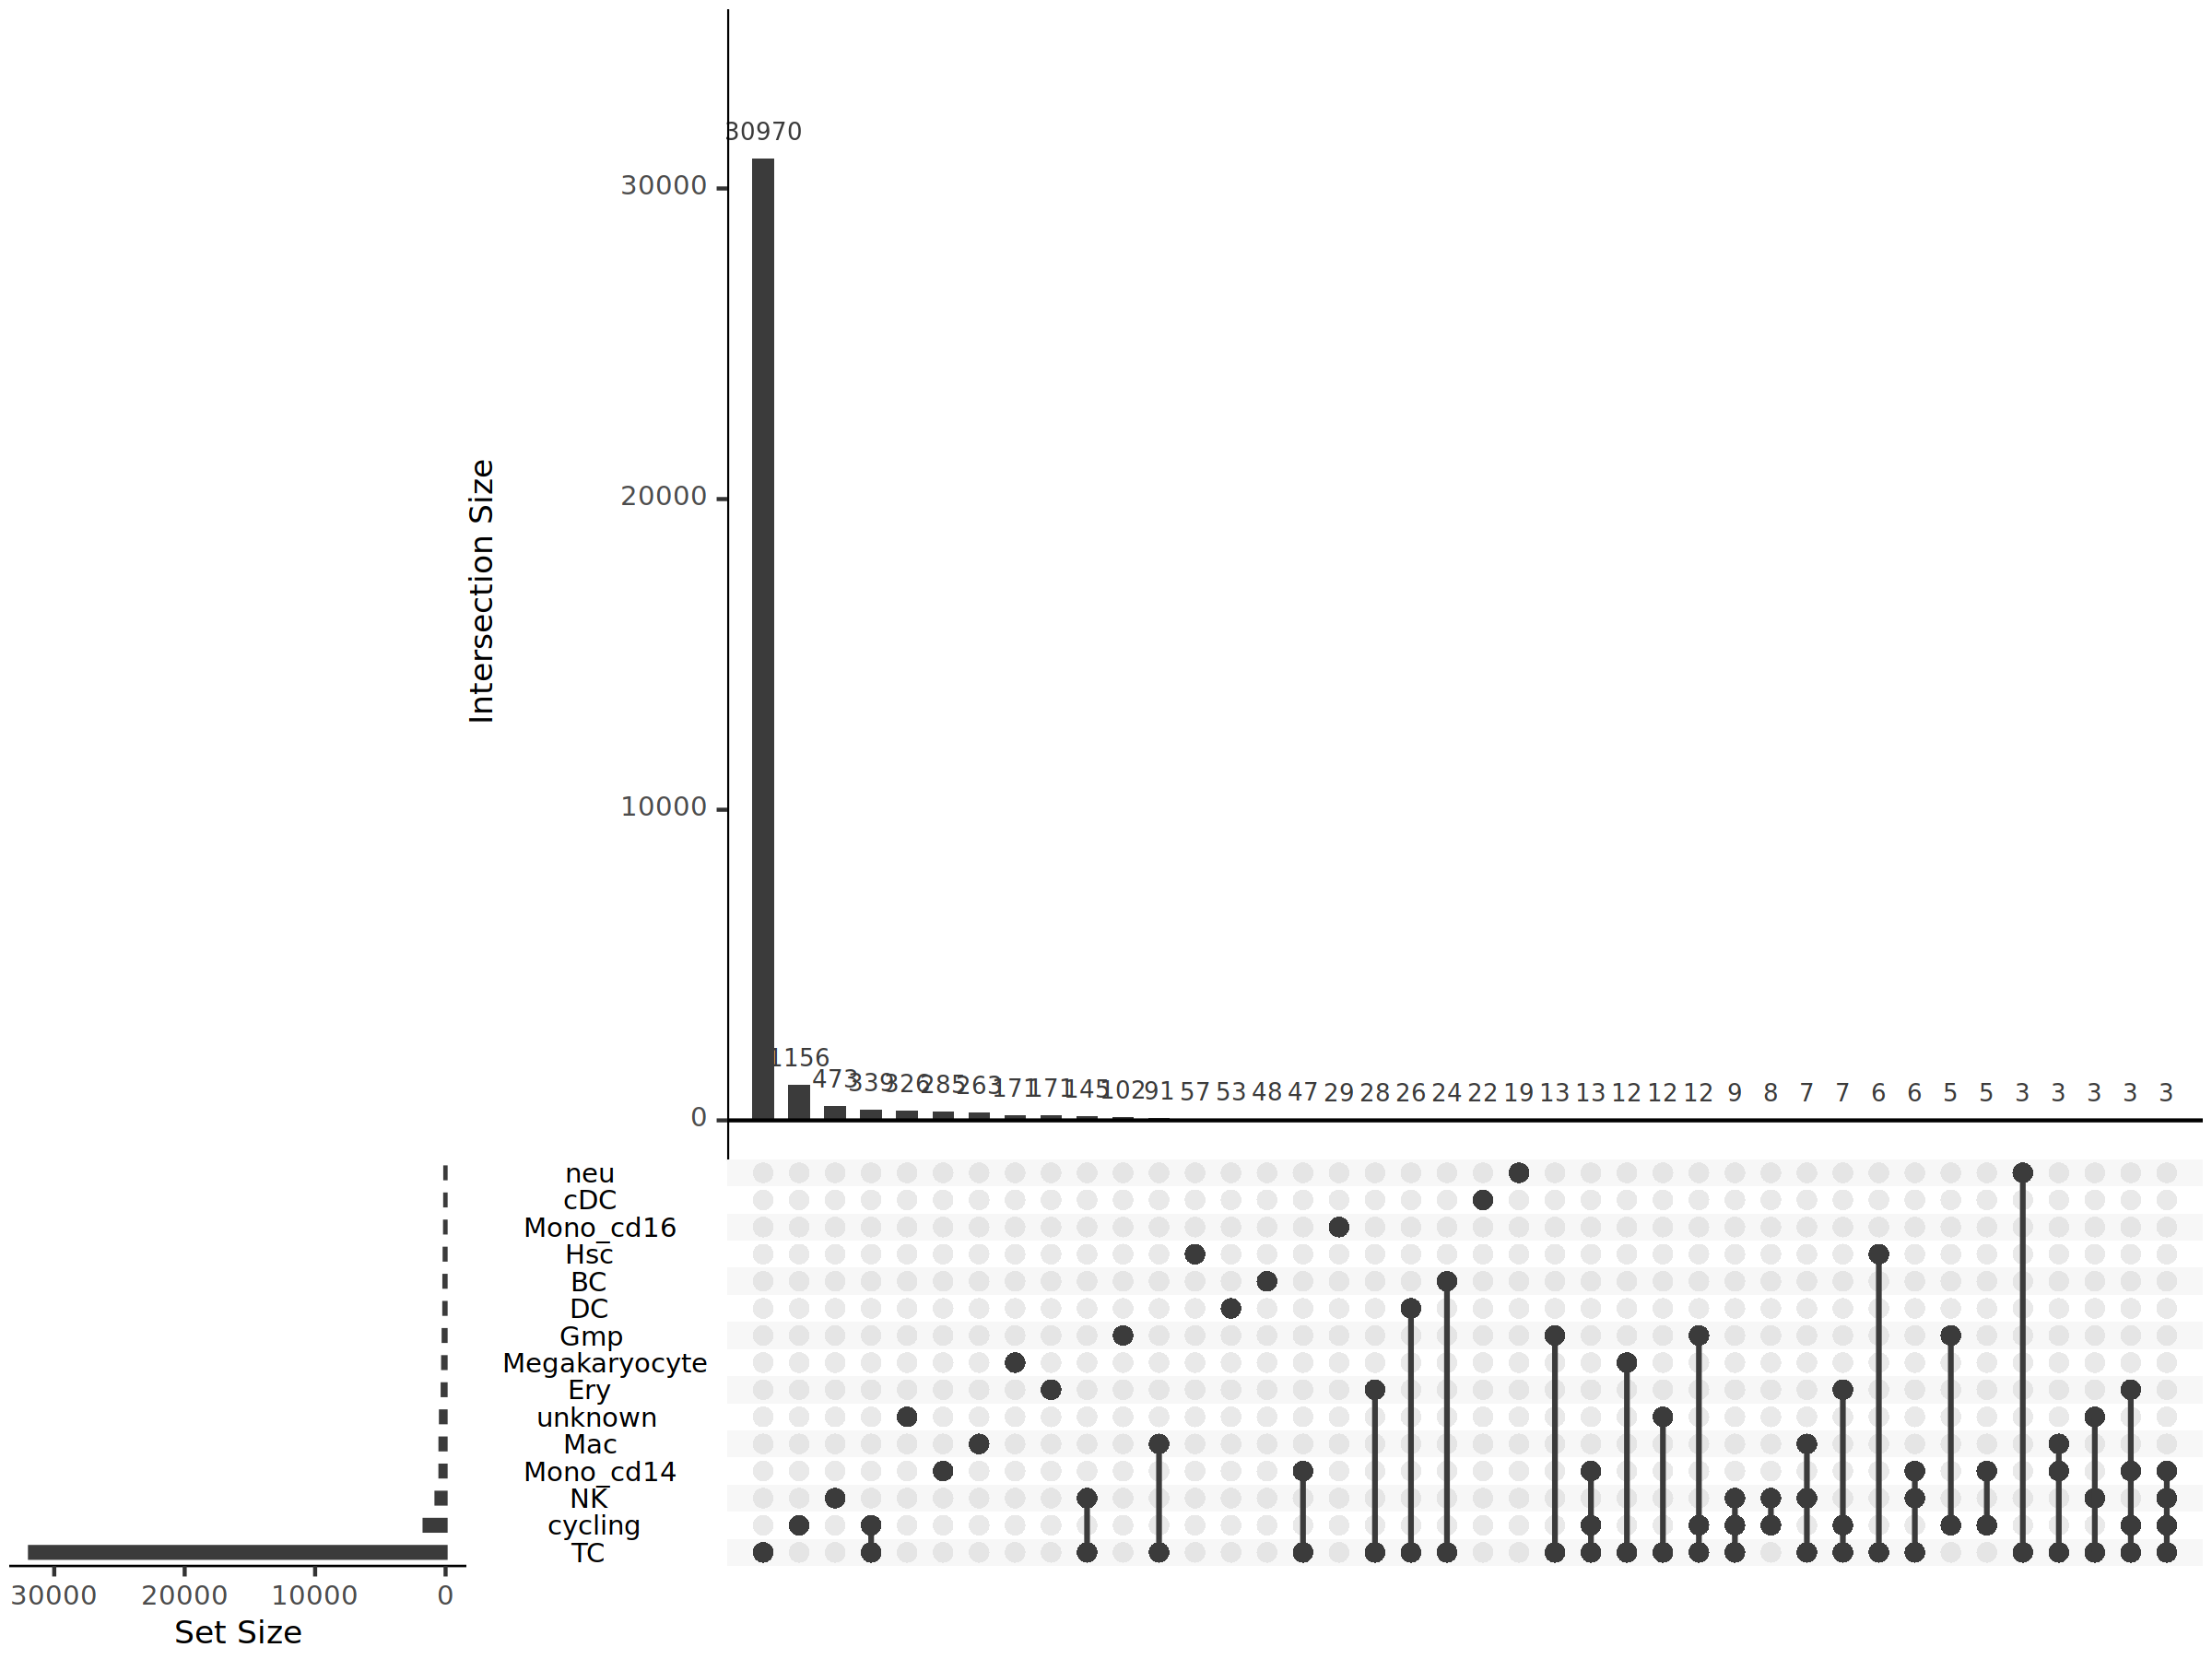
*The figure above is an UpSet plot showing shared and unique relationships of clonotypes between different cell populations. The horizontal bars on the left represent the total number of clonotypes in each cell population; in the bottom matrix, each column represents a cell population combination, with a single point indicating clones unique to that cell population and multiple vertically connected points indicating clones shared by those cell populations; the height of vertical bars above indicates the number of clonotypes in each combination. This plot clearly shows: (1) which cell populations have the most unique clones; (2) which cell population combinations share the most clones; (3) distribution patterns of shared clones and associations between cell populations.
Unique Clonotype Count Statistics
Counting the total number of clonotypes in each cell population allows assessment of clonal diversity across populations. The x-axis shows cell population names, and the y-axis shows the total number of clonotypes in each population (including both unique and shared clones).
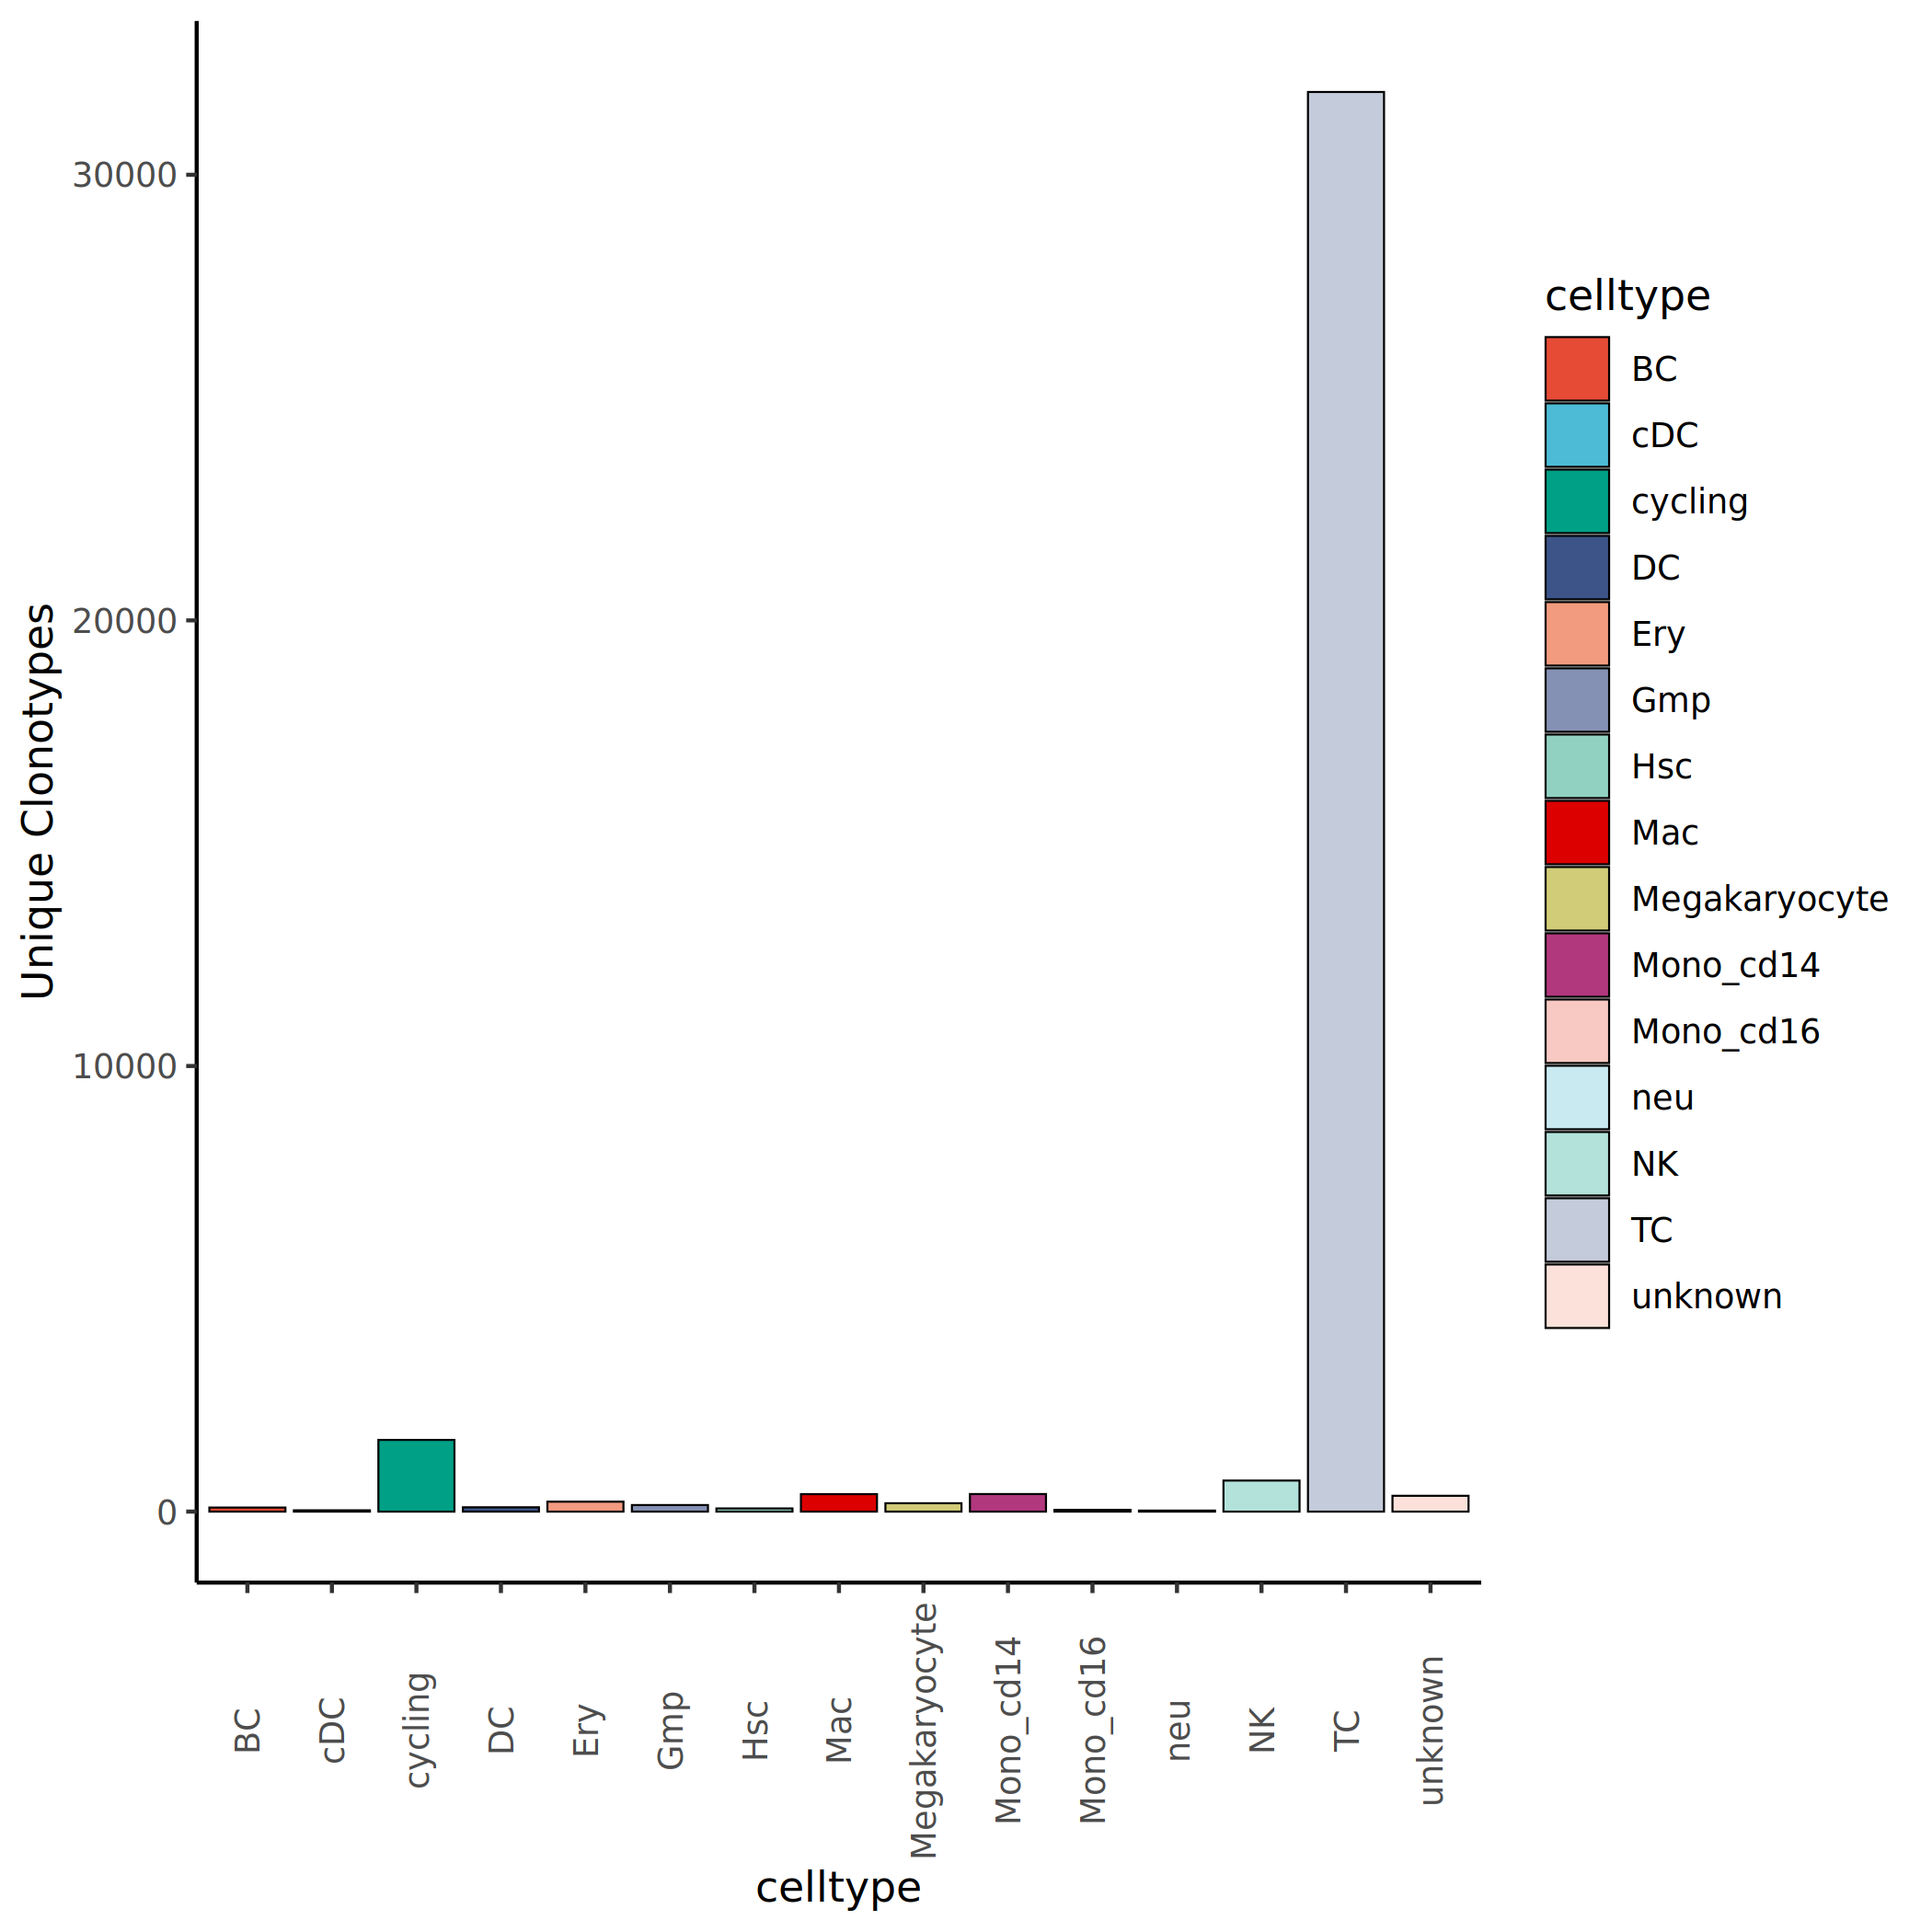
*The figure above shows the total number of clonotypes in each cell population. The x-axis represents cell population names, and the y-axis represents the number of clonotypes. It can be seen that different cell populations have varying numbers of clonotypes, which is related to cell count, degree of clonal expansion, and immune diversity. Cell populations with more clonotypes typically have higher immune diversity, while those with fewer clonotypes but higher clonal abundance suggest oligoclonal expansion.
Unique Clonotype Proportion Analysis
Calculate the proportion of unique clonotypes in each cell population (scaled = contigs/total), which is the ratio of unique clonotype count to total clonotype count in the population. A high proportion suggests the cell population has a unique clonotype repertoire, while a low proportion indicates the population shares more clonotypes with other populations.
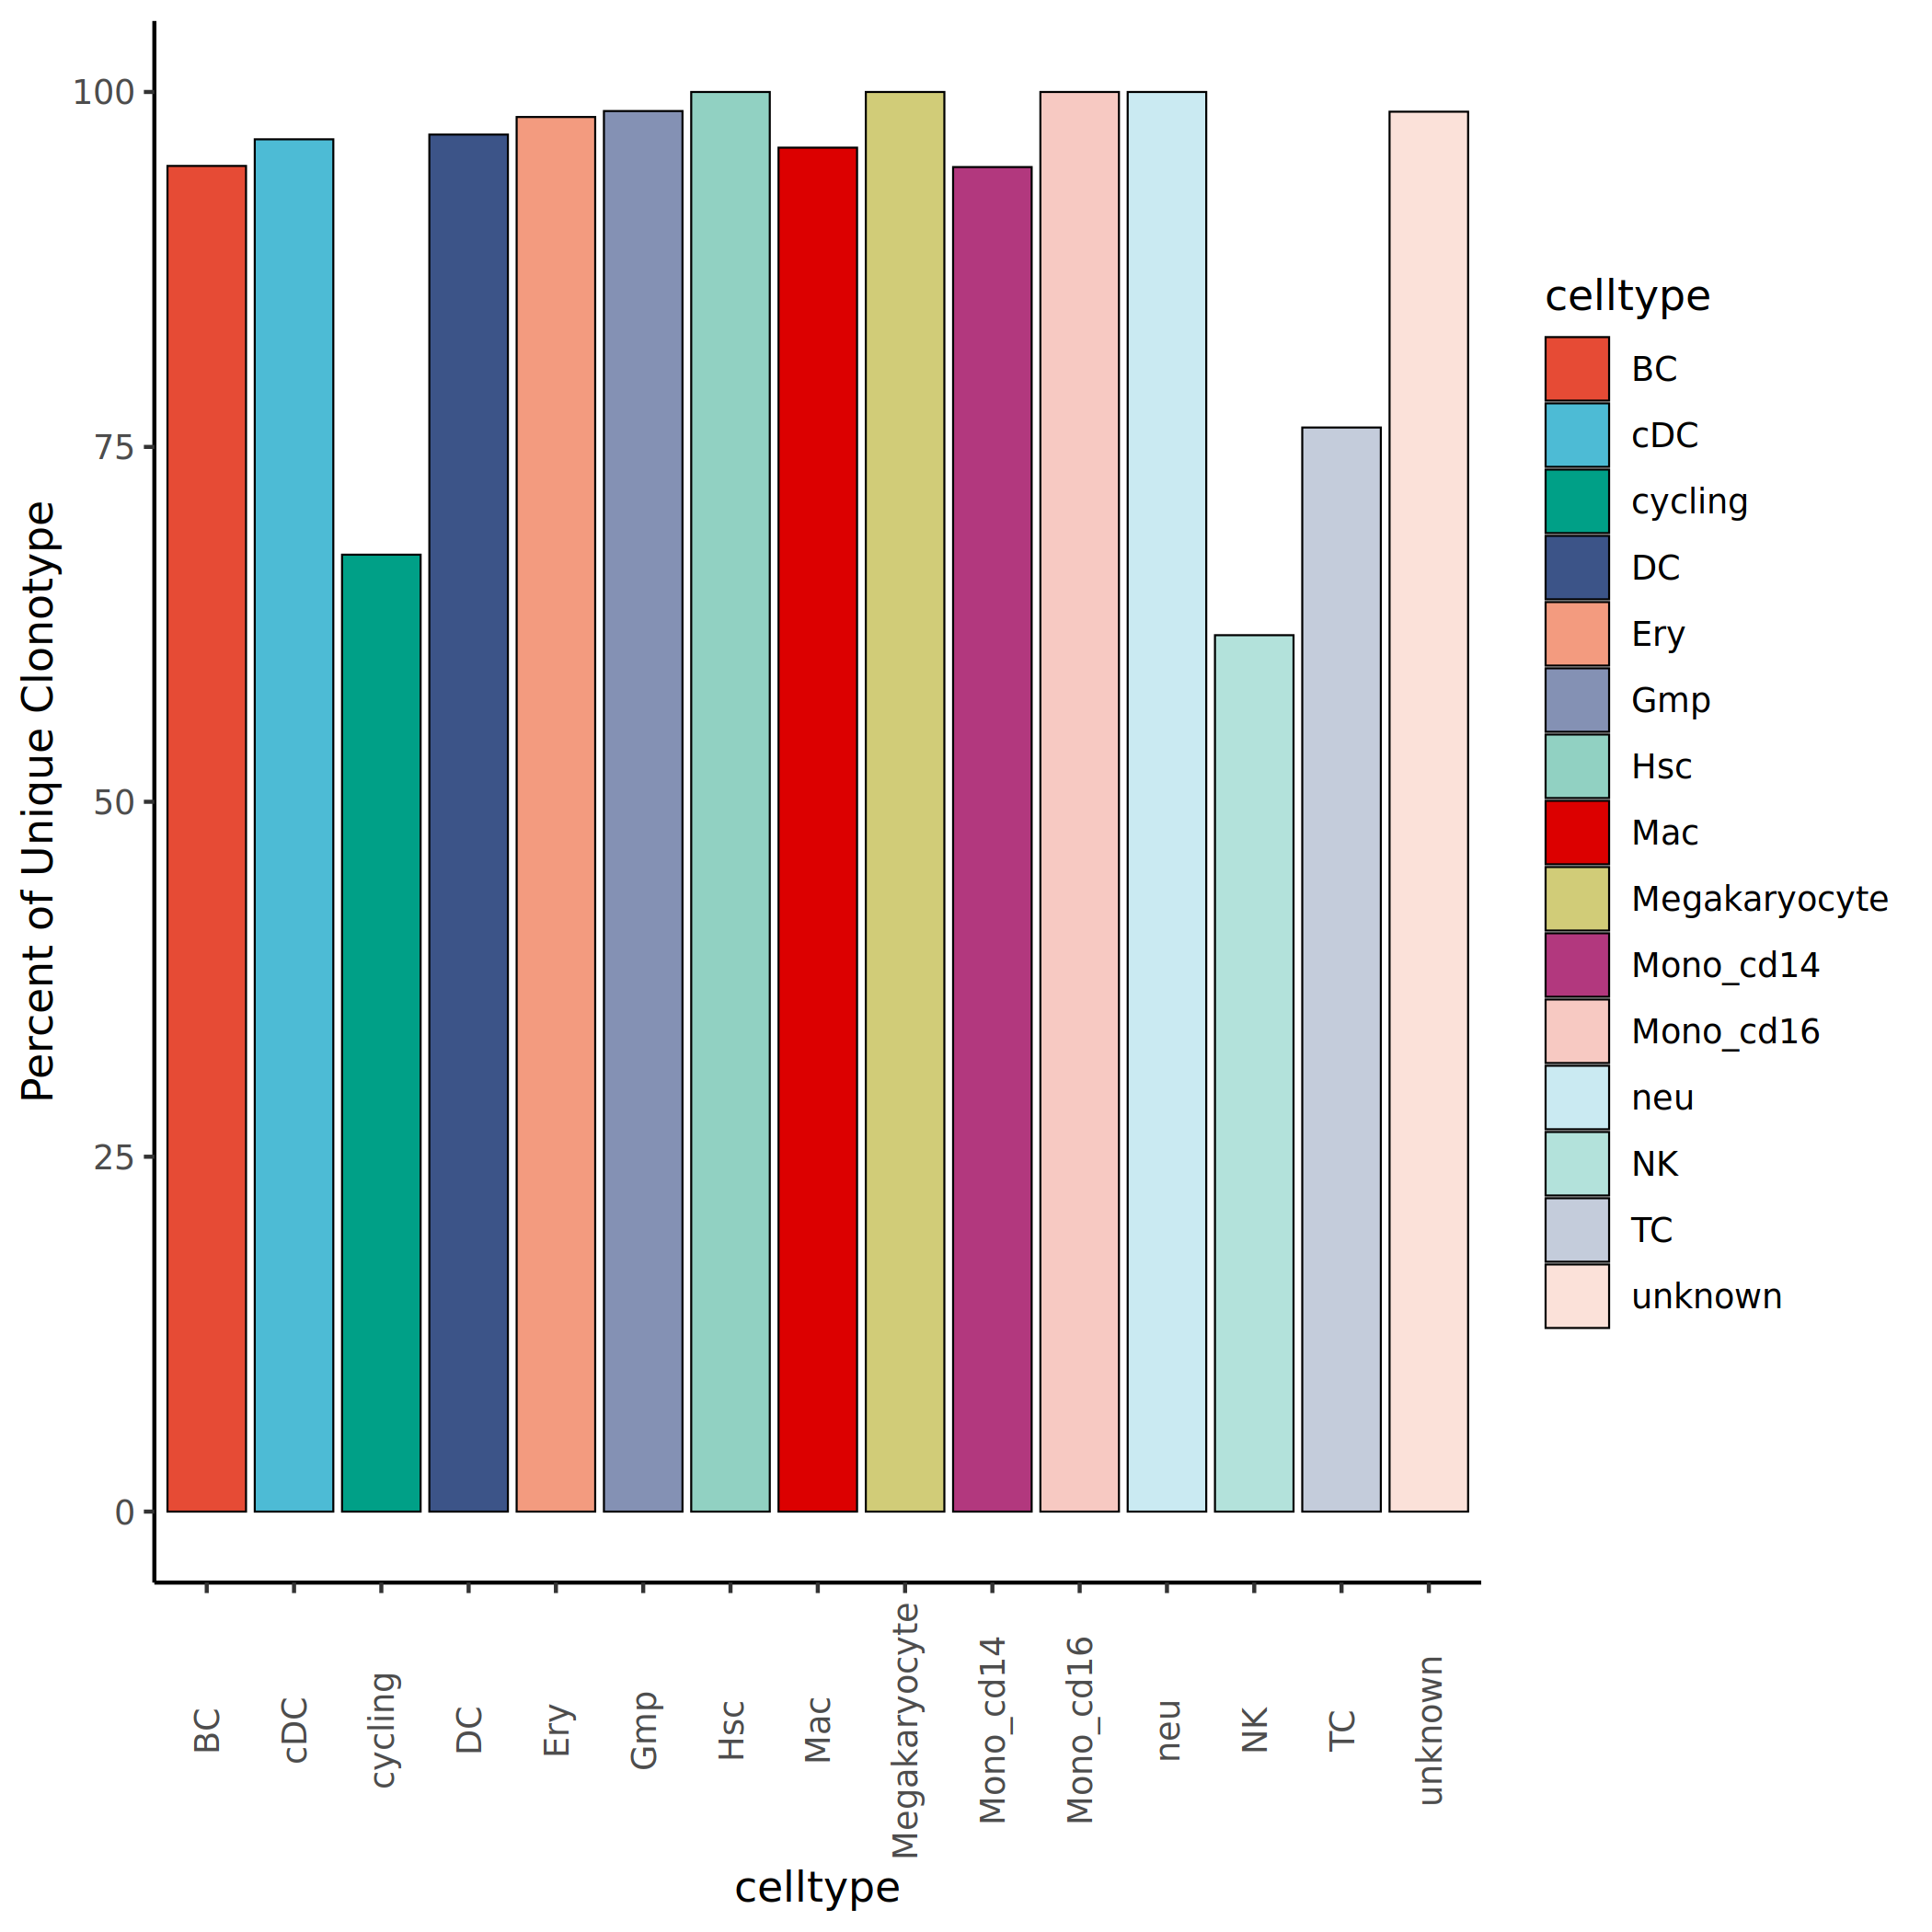
*The figure above shows the proportion of unique clonotypes in each cell population. The x-axis represents cell population names, and the y-axis represents the percentage of unique clonotypes. A higher proportion of unique clones suggests the cell population has distinctive immune reactivity and functional specificity; a lower proportion indicates the population shares more clonotypes with other populations, possibly due to clonal migration between populations or common antigen targets.
Clonotype Overlap Analysis (Morisita Overlap Index)
The Morisita Overlap Index is a statistical measure used to quantify the similarity of individual distributions between different populations. In immune repertoire analysis, this index can assess the overlap of clonotype composition between different cell populations or samples.
- Index range: 0 to 1.
- Approaching 1: Indicates highly similar clonotype composition between two cell populations with high clonotype overlap.
- Approaching 0: Indicates very different clonotype composition between two cell populations with low clonotype overlap.
- Biological interpretation:
- High overlap suggests cell populations may derive from common progenitor cells, recognize similar antigens, or have frequent cell migration and exchange.
- Low overlap suggests cell populations have independent clonal repertoires and different antigen specificities, reflecting functional differentiation and diversity of immune responses.
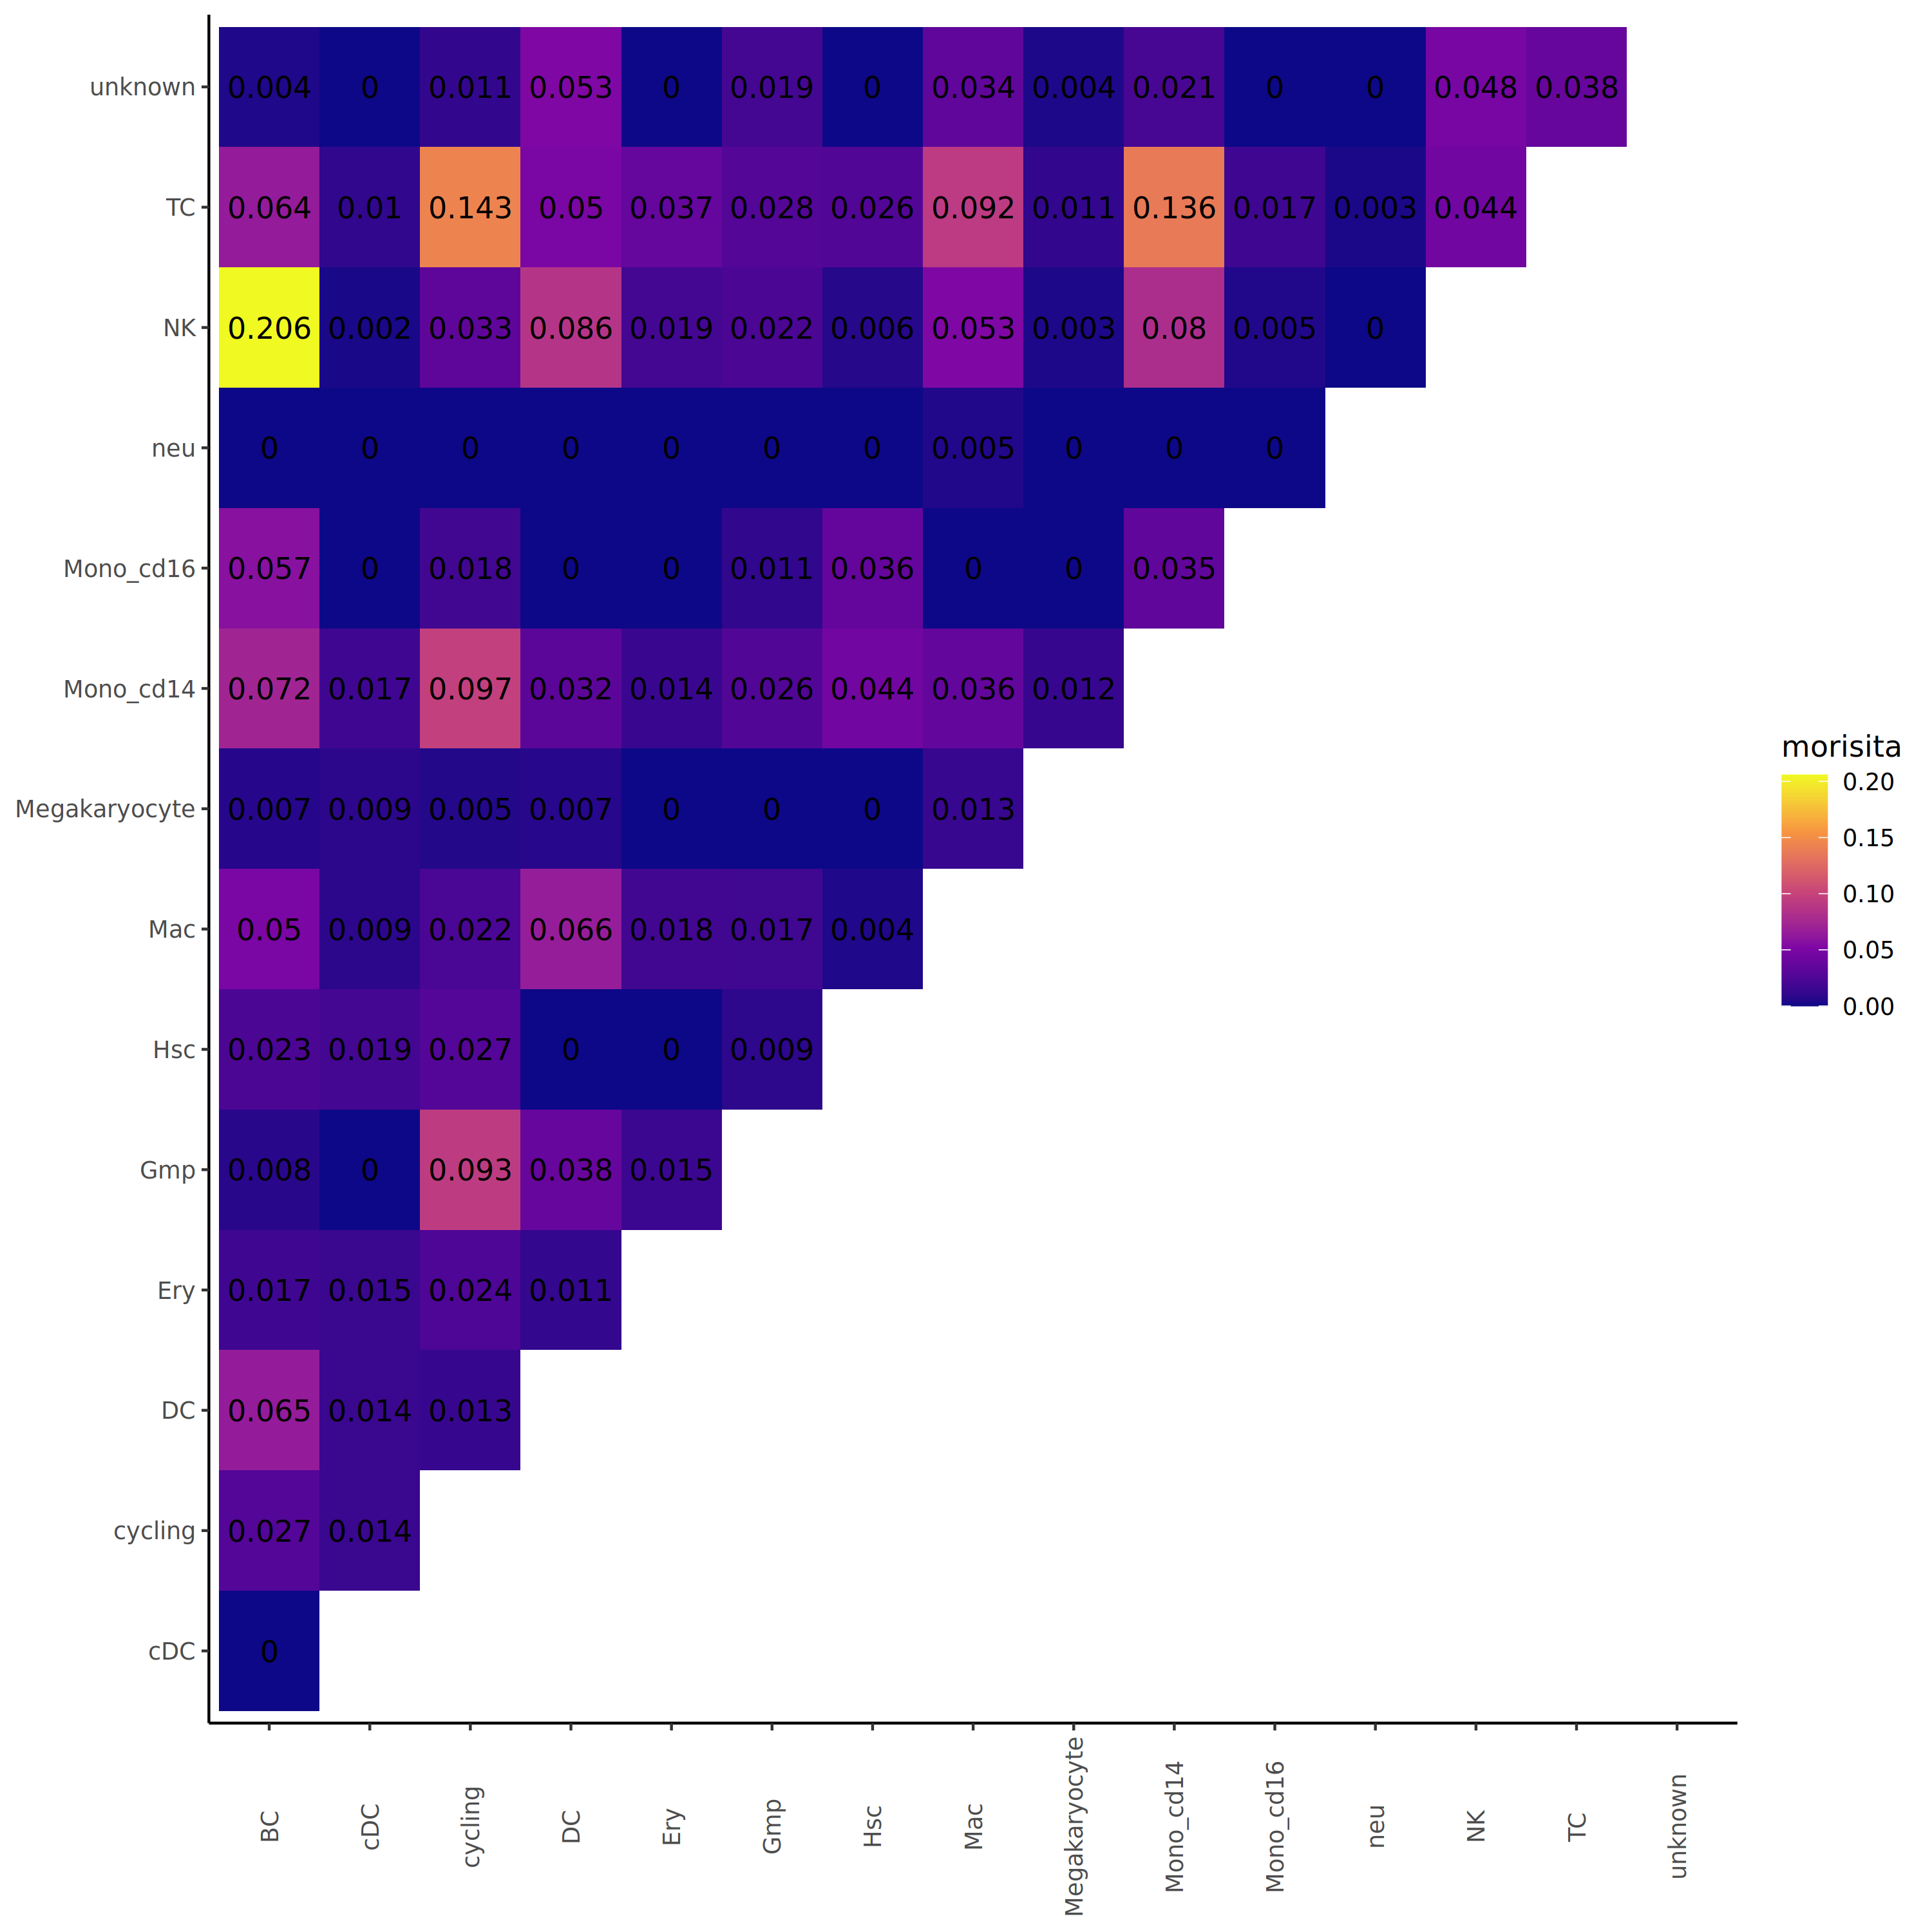
*The figure above shows the Morisita Overlap Index between different cell populations in heatmap form. Both the x and y axes represent cell population names, and colors represent overlap indices. Brighter colors (closer to yellow) indicate higher clonotype overlap between two cell populations with more similar clonal composition; darker colors (closer to purple) indicate lower overlap with greater differences in clonal composition. This heatmap helps identify which cell populations share similar clonotype repertoires and which maintain independent immune characteristics.
TIP
Key Points for Result Interpretation:
- Cell populations with a high proportion of unique clonotypes typically have distinctive functional properties and antigen specificities, reflecting their special role in immune responses.
- The presence of shared clonotypes suggests possible clonal migration between cell populations, common antigen recognition, or developmental lineage relationships.
- UpSet plots are suitable for multi-group comparisons and can clearly display complex clonal sharing relationships, superior to traditional Venn diagrams.
- The Morisita Overlap Index can quantify clonal composition similarity between cell populations; high overlap suggests functional relevance or developmental continuity.
- By comparing clonal overlap between healthy controls and disease samples, disease-related clonal expansion patterns can be identified.
- In longitudinal studies, tracking dynamic changes in shared clones can assess treatment efficacy and disease outcomes.
Clonal Expansion and Contraction Analysis
Clonal Expansion and Contraction are important characteristics of dynamic changes in T/B cell clonotypes during immune responses. By comparing clonotype composition between different samples or time points, we can identify which clones have expanded, contracted, or newly appeared, revealing the dynamic evolution of immune responses.
Biological Significance
The expansion and contraction of T/B cell clonotypes have important implications in immunology and disease research:
- Infection response: When the body encounters pathogens, specific T/B cell clonotypes are activated and undergo massive expansion to combat infection. This dynamic process of expansion and contraction helps clear pathogens and restore immune balance.
- Disease diagnosis and monitoring: The development of certain diseases (such as tumors, autoimmune diseases) may be accompanied by abnormal expansion or reduction of specific clonotypes. By detecting and analyzing changes in clonotypes, we can help diagnose diseases, assess disease progression, and monitor treatment efficacy.
- Treatment efficacy assessment: During immunotherapy (such as CAR-T, immune checkpoint inhibitors), tracking the expansion or contraction of specific clonotypes can evaluate treatment response and predict prognosis.
- Immune memory formation: The contraction phase following clonal expansion retains some memory cells, and these long-lived clones provide the basis for secondary responses.
In conclusion, clonal expansion and contraction are of great significance for immune responses, immune memory, immune monitoring, and immunotherapy. Research on these processes helps deepen understanding of immune system functions and disease mechanisms, providing guidance and strategies for the prevention, diagnosis, and treatment of immune-related diseases.
Clonal Expansion and Contraction Scatter Plot
By comparing frequency changes of clonotypes between two samples (or two time points), three types of clonotypes can be identified:
- Novel clones: Clonotypes newly detected in sample B but not in sample A (Fisher's exact p < 0.05), representing newly activated or recruited immune cell clones.
- Expanded clones: Clonotypes with significantly higher frequency in sample B than in sample A (Fisher's exact p < 0.05), suggesting the clone has undergone specific expansion, possibly related to antigen stimulation or immune activation.
- Contracted clones: Clonotypes with significantly lower frequency in sample B than in sample A (Fisher's exact p < 0.05), indicating the clone has undergone contraction or apoptosis, possibly reflecting immune response resolution or cell migration.
- Persistent clones: Clonotypes with no significant difference in frequency between the two samples (Fisher's exact p > 0.05), indicating the clone maintains relatively stable abundance in both samples, possibly representing baseline immune surveillance or long-lived memory clones.
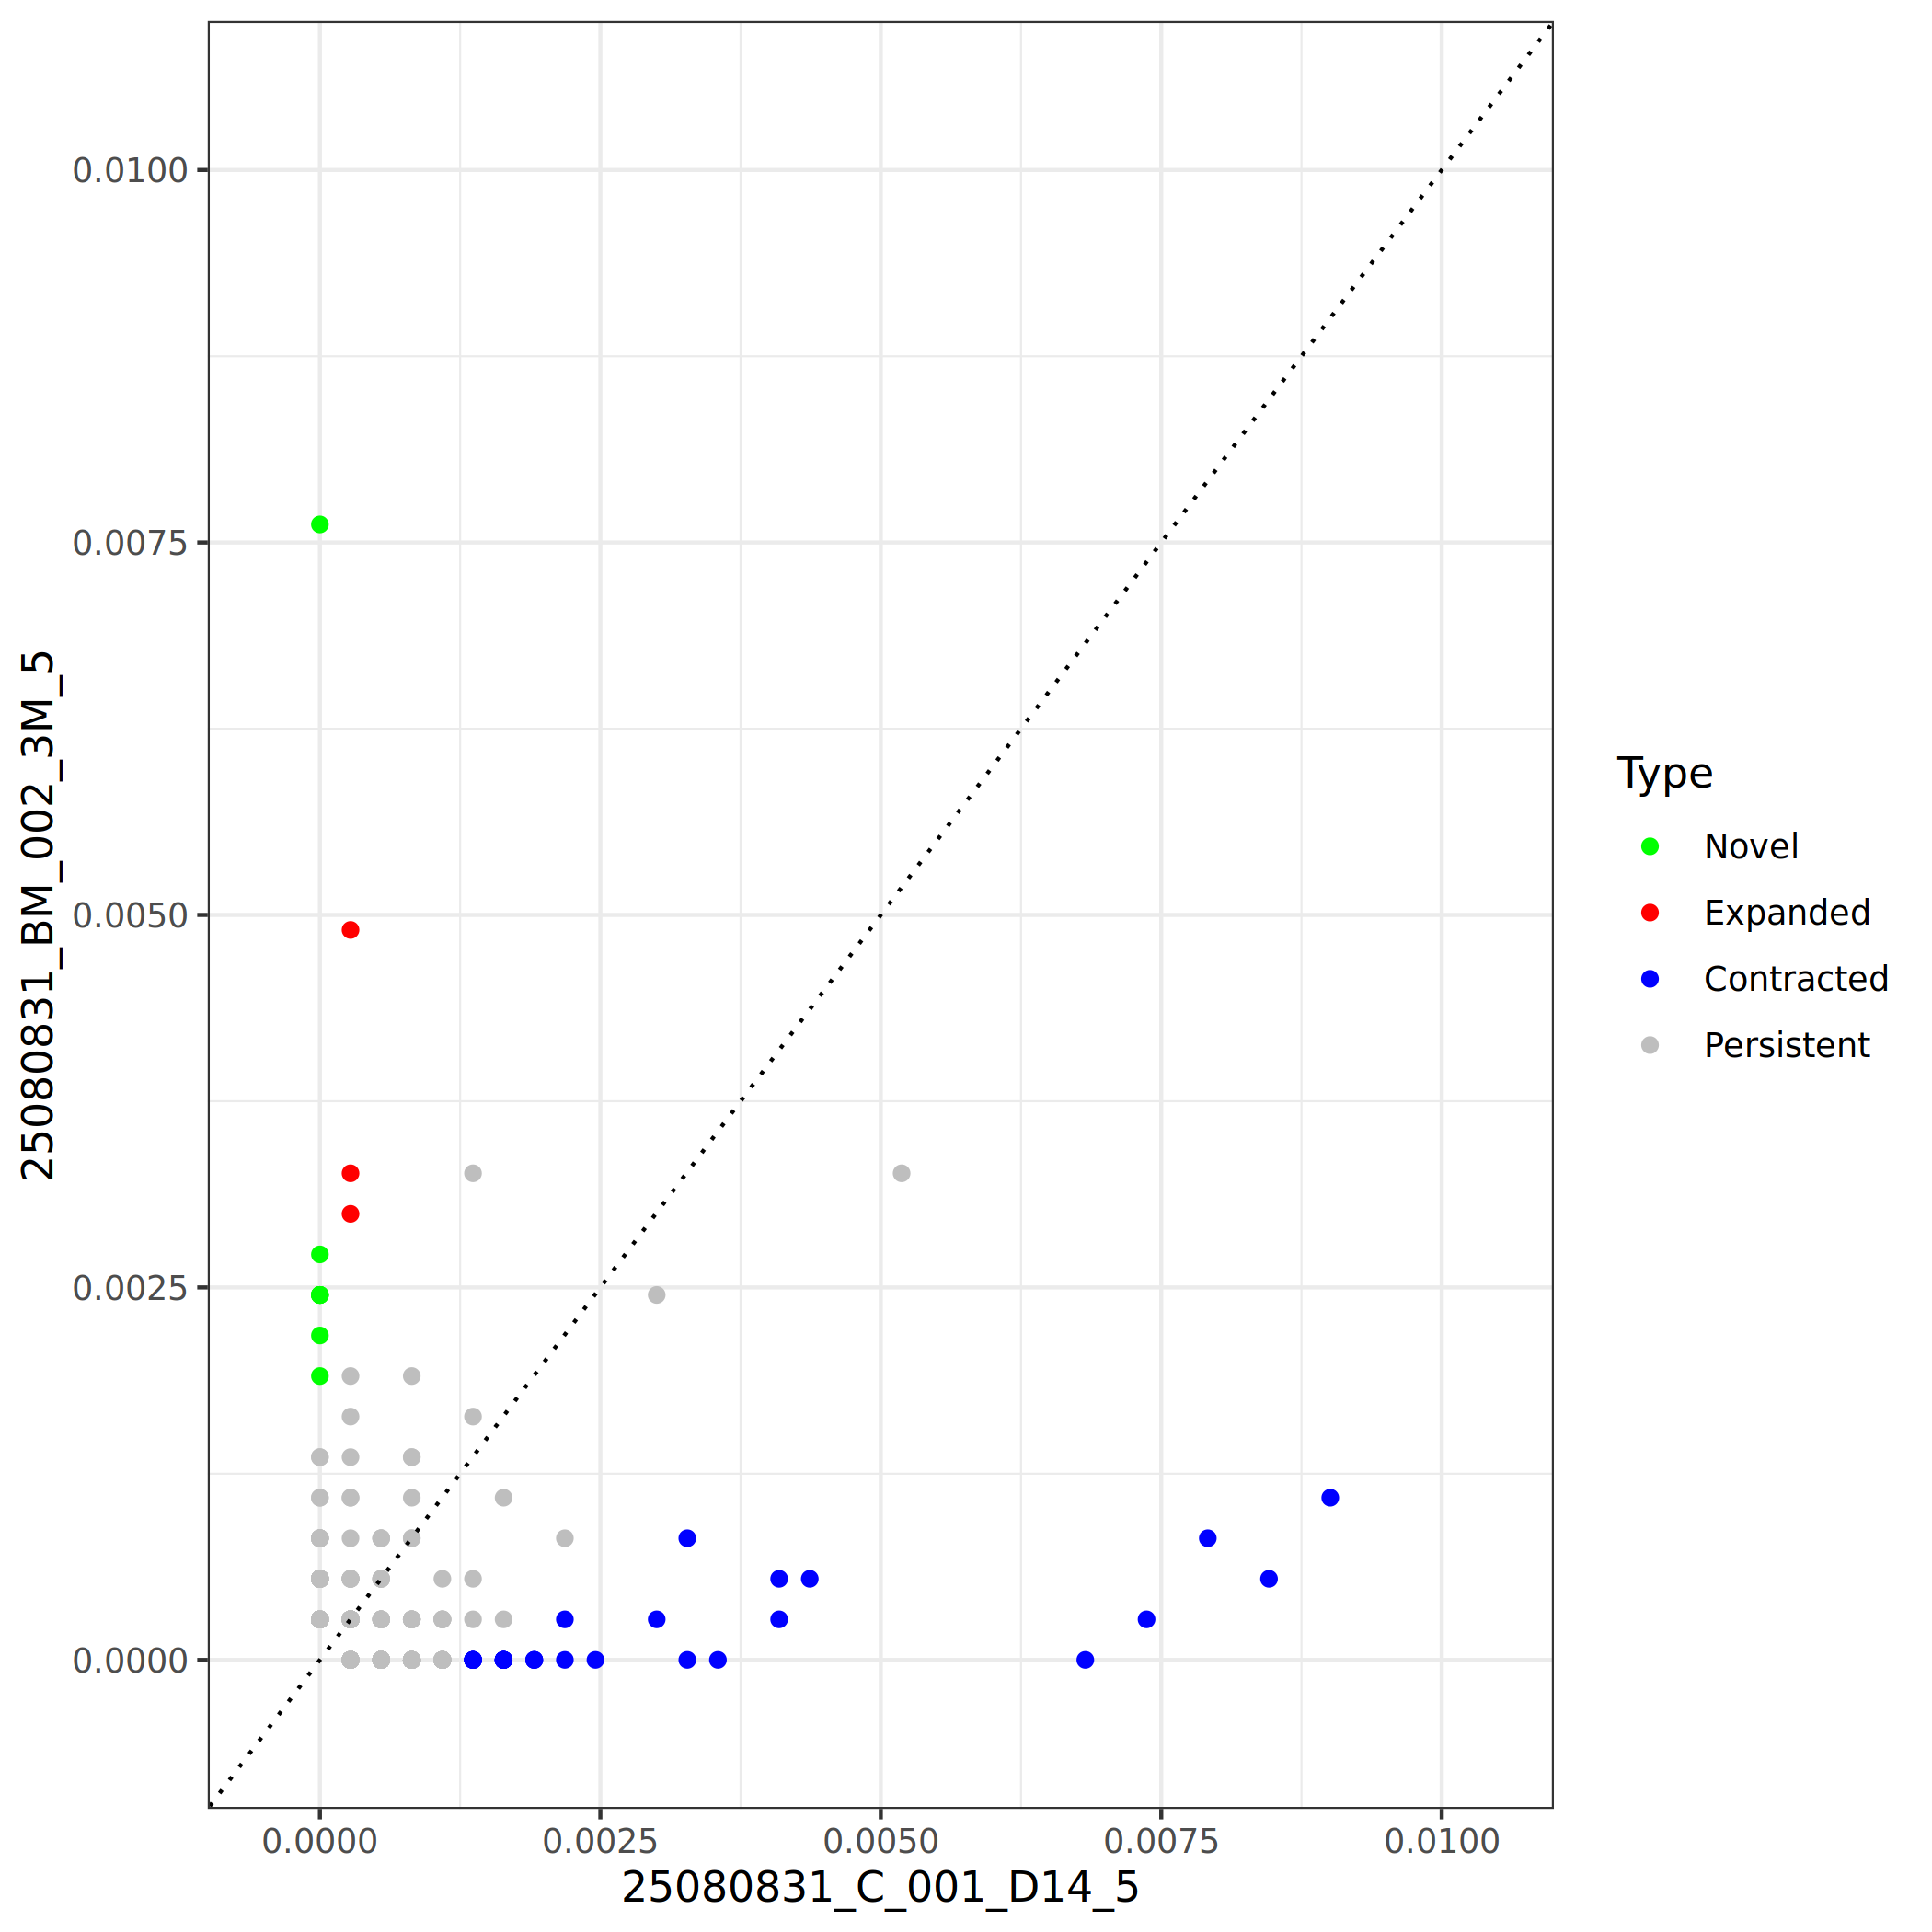
*The figure above shows the expansion and contraction analysis of clonotypes between two samples. Each point represents a clonotype, with the x-axis showing its frequency in sample A and the y-axis showing its frequency in sample B. Different colors represent different clone types: green for Novel clones, red for Expanded clones, blue for Contracted clones, and gray for Persistent clones (no significant change). The diagonal line indicates equal frequency in both samples. Points further from the diagonal line indicate more significant changes. This plot allows intuitive identification of which clones have undergone significant expansion or contraction, as well as the number and frequency of newly appeared clones.
Application Scenarios
Clonal expansion and contraction analysis has important applications in the following research scenarios:
- Longitudinal monitoring: Track clonal dynamics in the same patient at different treatment stages or disease progression, assessing disease status and treatment efficacy.
- Sample comparison: Compare clonal composition differences between different tissue sites (e.g., peripheral blood vs. tumor tissue) to reveal cell homing and migration patterns.
- Pre/post-treatment comparison: Identify treatment-related clonal expansion (such as CAR-T cell expansion) or regression of tumor-related clones to evaluate treatment response.
- Vaccine research: Monitor expansion dynamics of specific clones after vaccination to assess vaccine immunogenicity and persistence.
TIP
Key Points for Result Interpretation:
- A large number of expanded clones suggests strong immune activation or antigen stimulation, possibly related to infection, vaccination, or immunotherapy.
- Newly appeared clones may derive from newly recruited immune cells or activation of naive T/B cells.
- Contracted clones may reflect immune response resolution, cell apoptosis, or migration out of the tissue/sample.
- Significantly expanded clonotypes warrant further analysis of their CDR3 sequences and antigen specificities, as they may be disease-characteristic clones.
- Interpret clonal dynamic changes in combination with clinical information; for example, treatment responders typically show contraction of pathological clones and expansion of immune effector clones.
Clonal Diversity Analysis
Clonal diversity is a critical indicator for assessing the complexity and health status of immune repertoires. Highly diverse immune repertoires typically indicate broader antigen recognition capabilities and stronger immune response potential, while reduced diversity may suggest immune aging, immune deficiency, or clonal diseases.
Introduction to Diversity Indices
Diversity analysis of immune repertoires typically involves multiple diversity indices, each describing clonotype distribution characteristics from different perspectives:
- Shannon index: Considers both richness (quantity) and evenness (distribution) of clonotypes; higher values indicate greater diversity.
- Simpson index: Measures the probability that two randomly selected cells belong to the same clonotype; lower values indicate greater diversity.
- Inverse Simpson index: The reciprocal of the Simpson index; higher values indicate greater diversity, more intuitively reflecting diversity levels.
- Chao1 index: Estimates the total number of clonotypes in a sample (including unobserved rare clones) and is used to assess clonal richness.
- Gini index: Measures the degree of unevenness in clonotype distribution; higher values indicate clones are more concentrated among a few dominant clones.
In this analysis, we used Immunarch software to calculate and visualize the diversity metrics of the samples.
Inverse Simpson Index Analysis
The Inverse Simpson index is the reciprocal of the Simpson index, ranging from 1 to infinity. Larger index values indicate higher clonal diversity, with more different clonotypes in the sample; conversely, smaller index values indicate lower clonal diversity, with more uniform clonotypes or oligoclonal dominance in the sample.
The advantage of the Inverse Simpson index is its high sensitivity to dominant clonotypes, effectively capturing diversity declines caused by clonal expansions within immune repertoires.
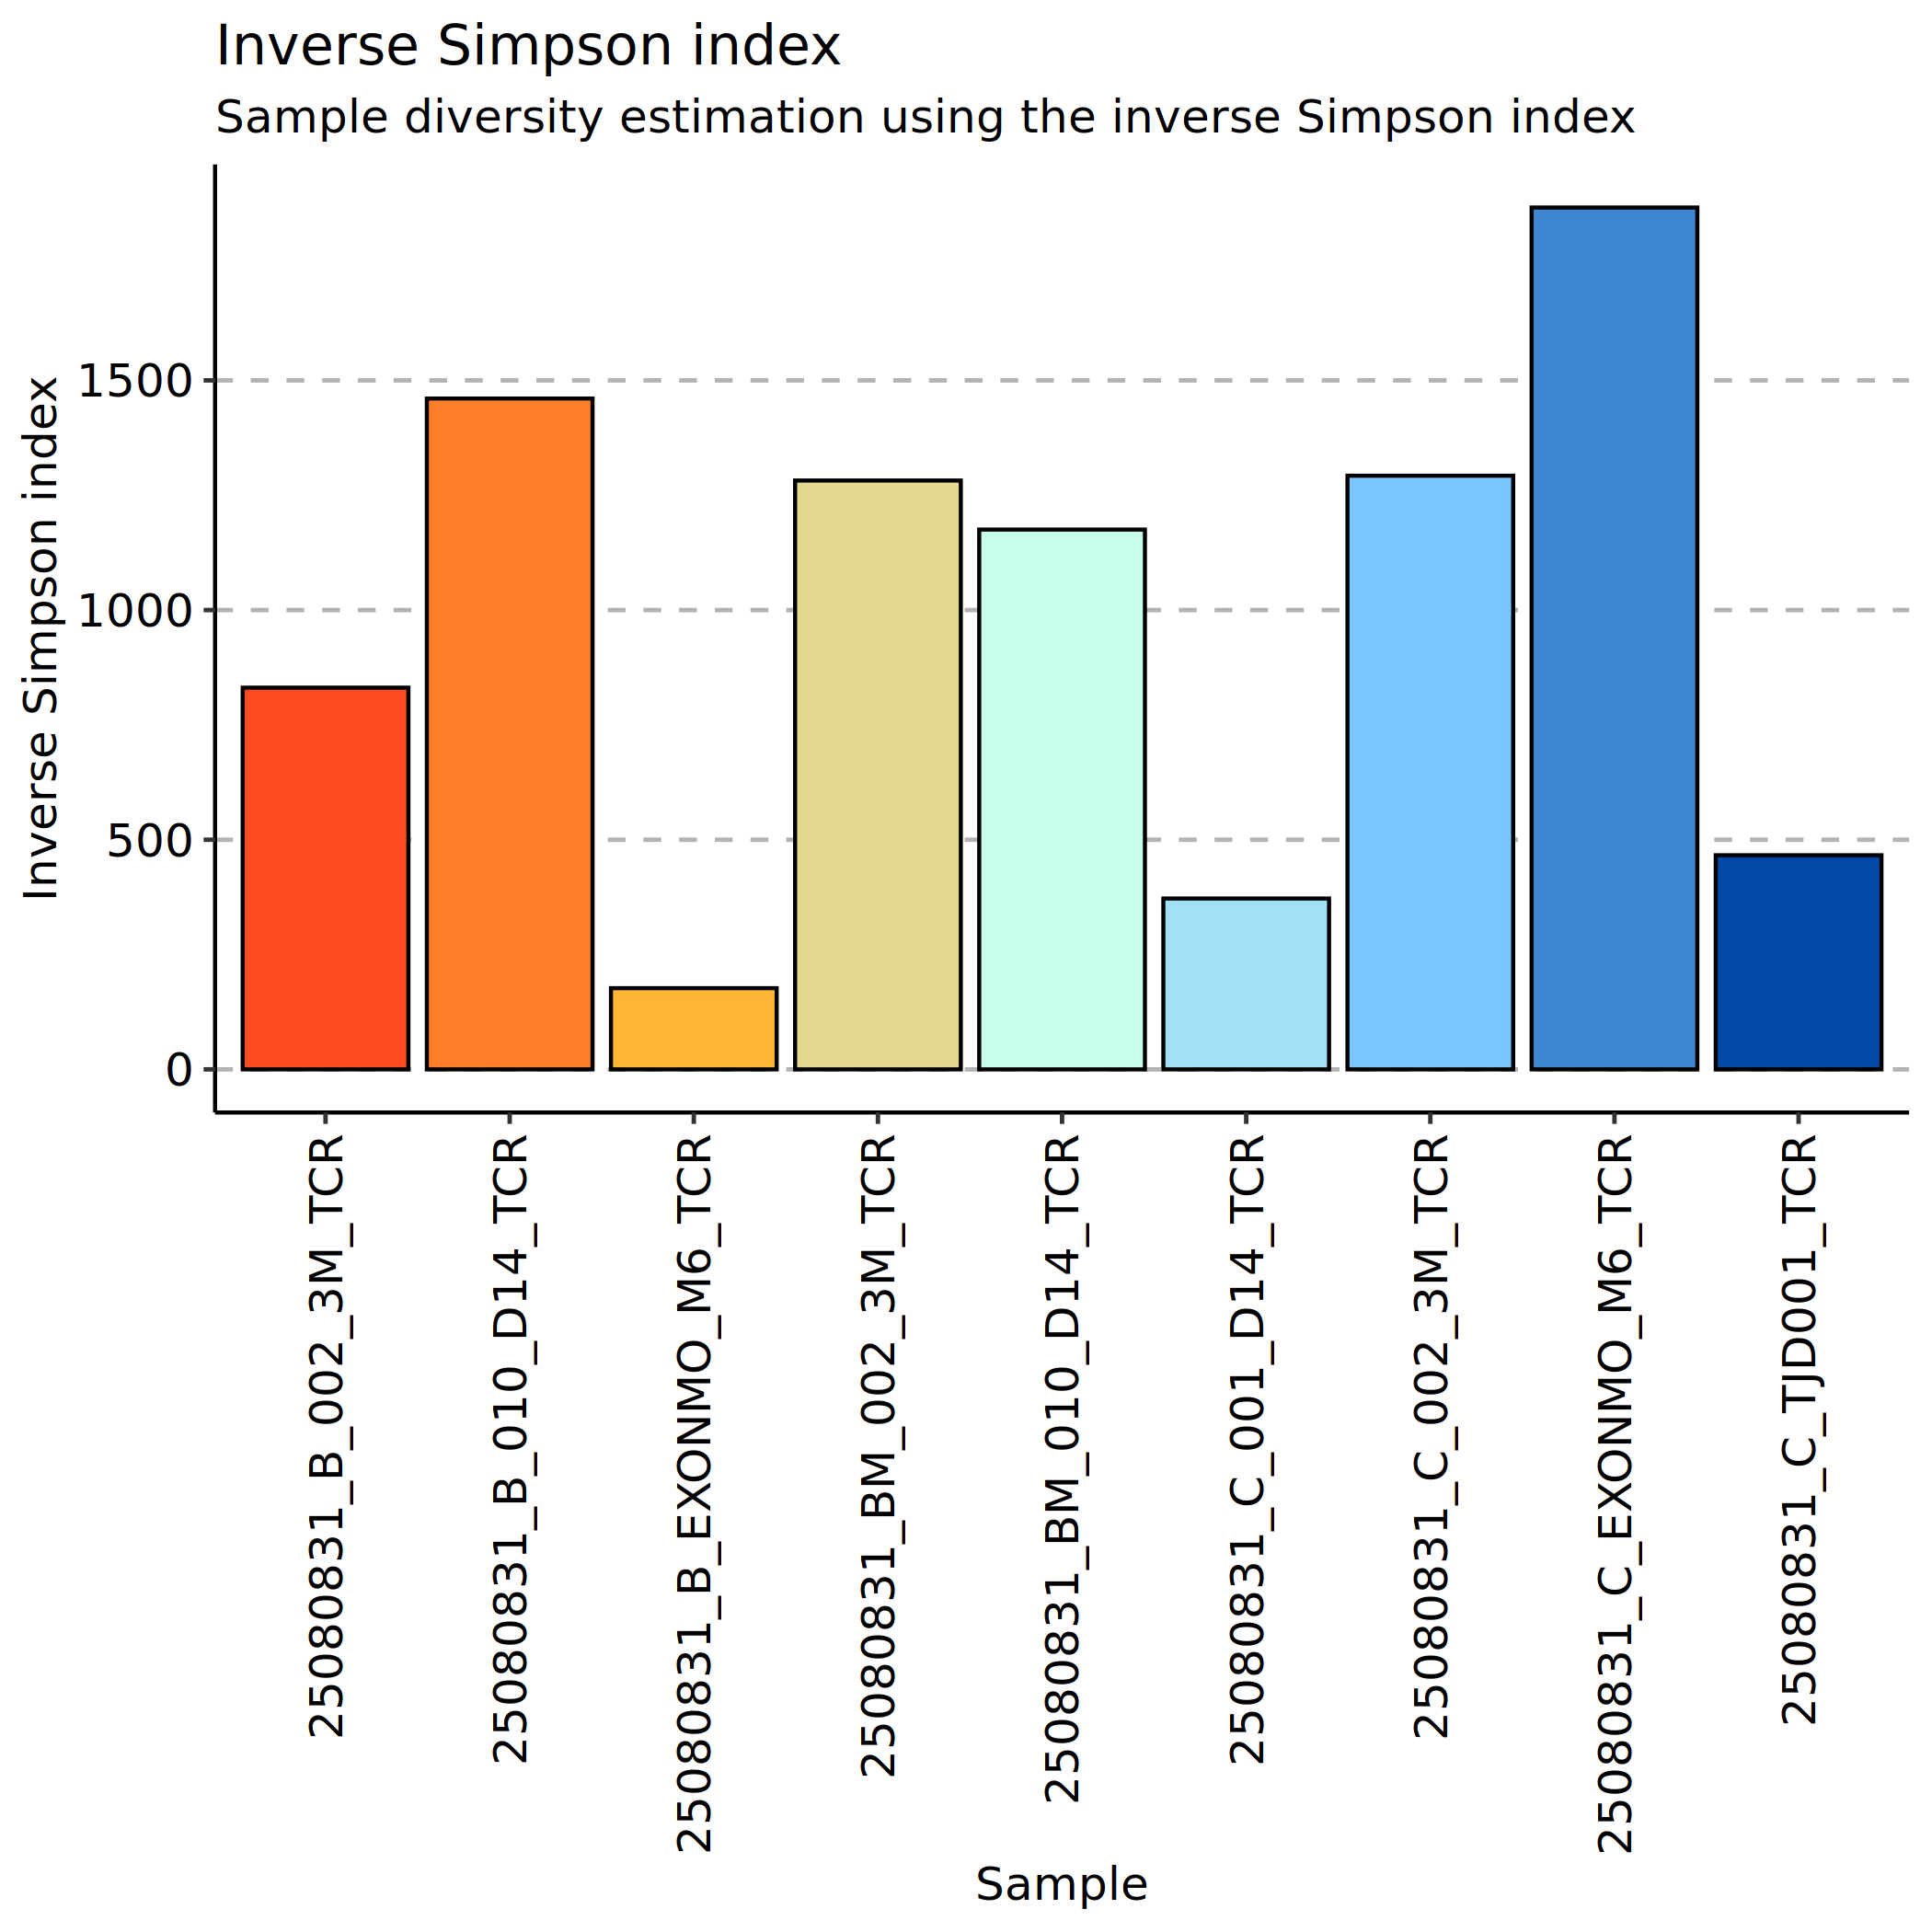
*The figure above shows the Inverse Simpson index for each sample. The x-axis shows sample names, and the y-axis shows Inverse Simpson index values. Each point represents a sample, and the height of the bar chart reflects the clonal diversity level of that sample. Higher index values indicate higher clonal diversity in the sample, reflecting rich clonotype types with relatively balanced distribution; lower index values indicate reduced diversity, with obvious oligoclonal dominance where a few clonotypes occupy a dominant position. By comparing diversity differences between different samples or groups, we can assess disease status, treatment efficacy, or immune system function.
Chao1 Index Analysis
The Chao1 index is a commonly used method to assess clonal richness in samples. Based on the number of observed clonotypes in the sample and their frequency of occurrence, it uses statistical methods to estimate the number of unobserved rare clones, thereby inferring the clonal richness of the entire sample.
Larger Chao1 index values indicate more estimated total clonotypes and higher clonal richness. The advantage of this method is that it accounts for the presence of rare clones (such as those appearing only once or twice), which is particularly valuable for assessing the potential diversity of immune repertoires.
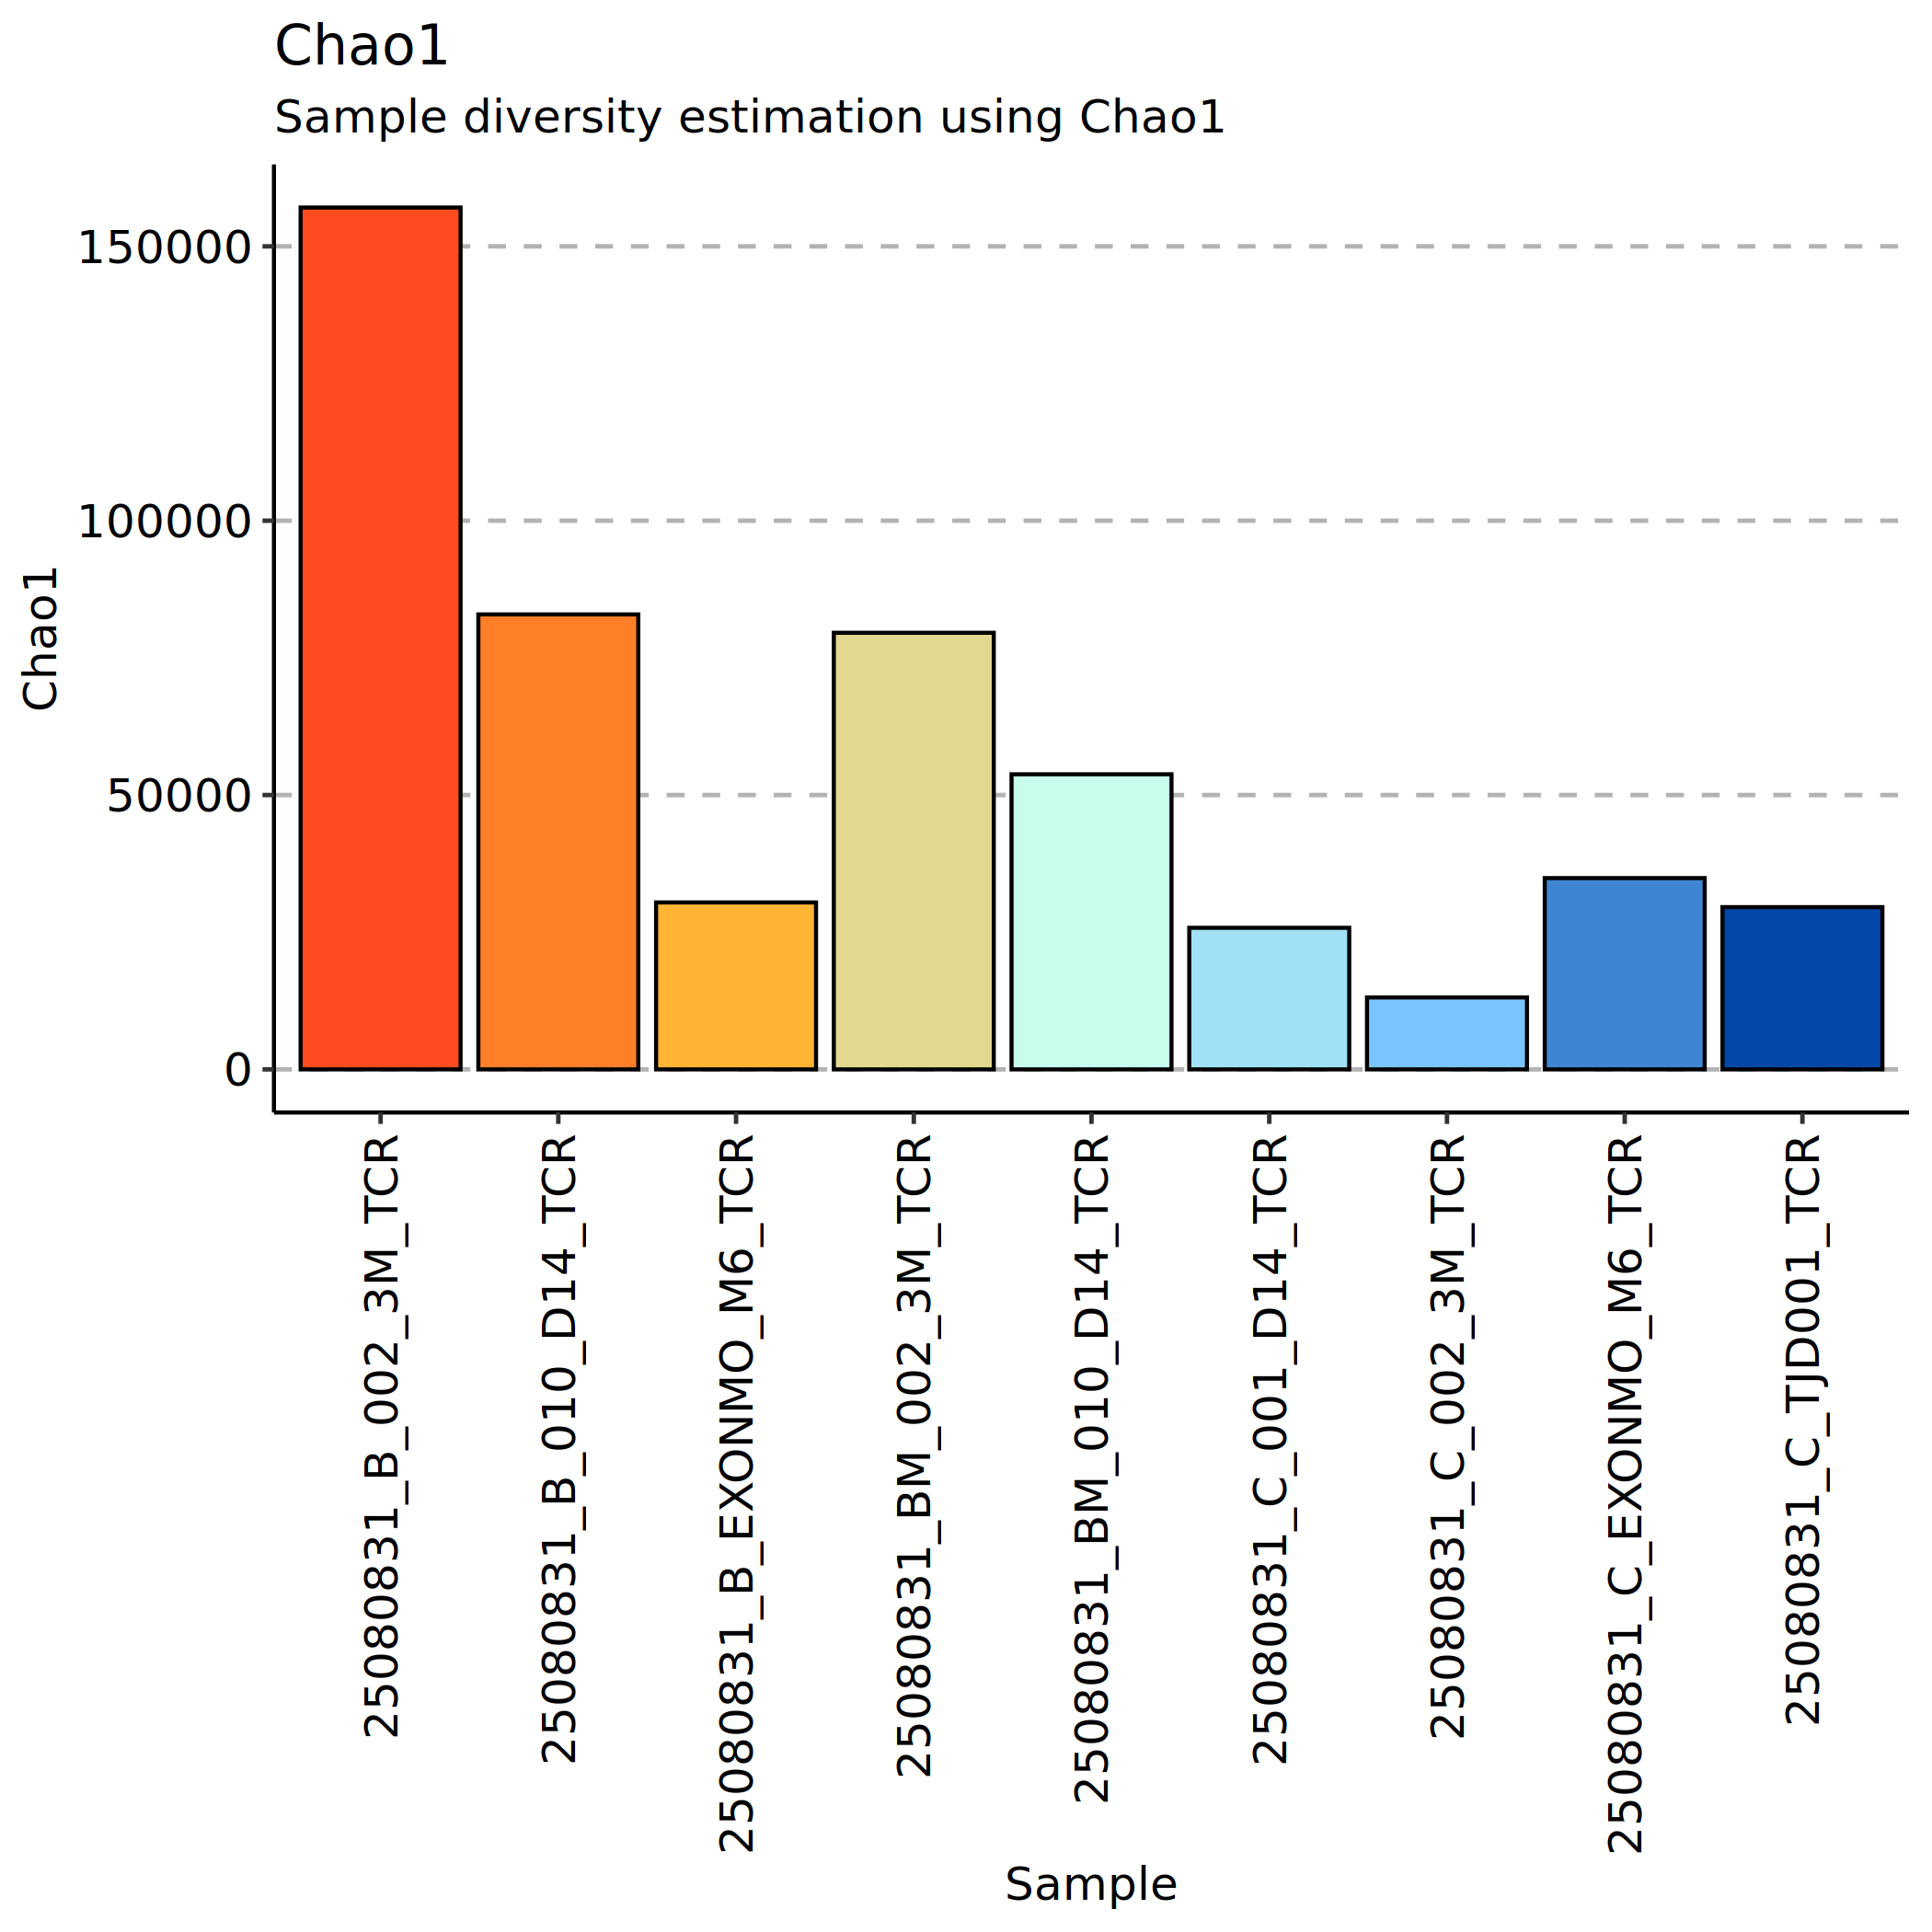
*The figure above shows the Chao1 index for each sample. The x-axis shows sample names, and the y-axis shows Chao1 index values. Each point represents the estimated clonal richness of a sample. Higher Chao1 indices indicate more total clonotypes (including rare clones) in the sample and a richer immune repertoire. This index is more sensitive to sequencing depth and rare clone capture and can be used to assess the adequacy of sample collection and the complexity of immune repertoires.
Biological Significance of Diversity Indices
- Health assessment: Healthy individuals typically have higher clonal diversity and can respond to diverse antigen challenges. Reduced diversity may indicate immune aging, immunosuppression, or immune deficiency.
- Disease diagnosis: Certain diseases (such as leukemia, lymphoma) show abnormal expansion of specific clones, leading to significant diversity decline. Abnormal diversity indices can serve as auxiliary indicators for disease diagnosis.
- Treatment monitoring: When immunotherapy (such as PD-1 inhibitors) is effective, increased or restored clonal diversity is usually observed, reflecting improved immune system function.
- Prognostic assessment: Some studies have shown that higher clonal diversity is associated with better treatment response and prognosis, serving as a predictive biomarker.
TIP
Key Points for Result Interpretation:
- The Inverse Simpson index and Chao1 index are complementary: Inverse Simpson focuses on assessing the evenness of clone distribution (whether dominant clones exist) and is sensitive to clonal expansion; Chao1 focuses on estimating the total number of clone types (including rare clones), reflecting the richness of the immune repertoire. Combined, they can comprehensively assess the complexity and health status of immune repertoires.
- Interpretation of diversity indices requires consideration of clinical context: For example, during acute infection, specific clonal expansion may cause a temporary decrease in diversity, which is a normal immune response.
- Different sample types have different diversity baselines: Peripheral blood typically has higher diversity than tissue-infiltrating cells.
- Longitudinal monitoring of diversity changes is more meaningful than single measurements and can reveal dynamic evolution of immune status.
- Comprehensive analysis combining other indicators (such as clonal expansion, shared clones) can lead to a more complete understanding of immune repertoire characteristics and functional status.
- Low diversity is not always pathological: Under specific antigen stimulation, normal immune responses also show expansion of relevant clones and a decrease in overall diversity.
Cell Subtype TCR Epitope Annotation Analysis (TCR)
TCR epitope annotation analysis involves comparing detected TCR sequences against known antigen-specific TCR databases to infer potential antigen epitopes recognized by the TCR and their associated diseases or pathological states. This analysis helps understand the targeting of T cell immune responses and provides important clues for disease diagnosis, immunotherapy, and vaccine design.
Biological Significance
TCR epitope annotation has important application value in immunological research:
- Disease-specific T cell recognition: By annotating TCR sequences, we can identify T cell clones associated with specific diseases (such as tumors, viral infections, autoimmune diseases) and reveal characteristics of disease-specific immune responses.
- Immunotherapy target discovery: Identifying TCRs recognizing tumor-specific or tumor-associated antigens provides candidate targets for immunotherapy strategies such as TCR-T cell therapy and personalized vaccines.
- Infectious disease monitoring: Detecting TCRs associated with specific pathogens (such as viruses, bacteria) helps assess the body's immune response status to infection and establishment of memory immunity.
- Autoimmune disease mechanism research: Identifying TCRs recognizing self-antigens helps understand the pathogenesis of autoimmune diseases and patterns of tissue-specific damage.
- Vaccine efficacy assessment: By tracking the expansion and persistence of vaccine-related antigen-specific TCRs, we can evaluate the immunogenicity and protective effects of vaccines.
McPAS-TCR Database
McPAS-TCR (Manual Curation of Pathology Associated T cell Receptor Sequences) is a manually curated database of pathology-associated TCR sequences that contains a large number of experimentally validated TCR sequences related to specific antigens and diseases. The database covers:
- Multiple disease types: Including cancer, viral infections (such as HIV, CMV, EBV, influenza, etc.), autoimmune diseases, bacterial infections, and more.
- Antigen information: Records specific epitope sequences recognized by TCRs, antigen sources, and MHC restrictions.
- TCR sequence information: Contains detailed information such as CDR3 sequences of TCR α and β chains, V/J gene usage, etc.
- Experimental validation basis: All entries come from published literature with clear experimental evidence support.
By comparing TCR sequences detected in samples with the McPAS-TCR database, we can annotate potential antigen-specific TCRs and infer their possible involvement in pathological processes.
Disease-associated TCR Annotation Results
By comparing against the McPAS-TCR database, we can count the number of TCRs detected in samples that are associated with different diseases. Analysis results display the distribution of pathology-associated TCRs annotated in each sample.
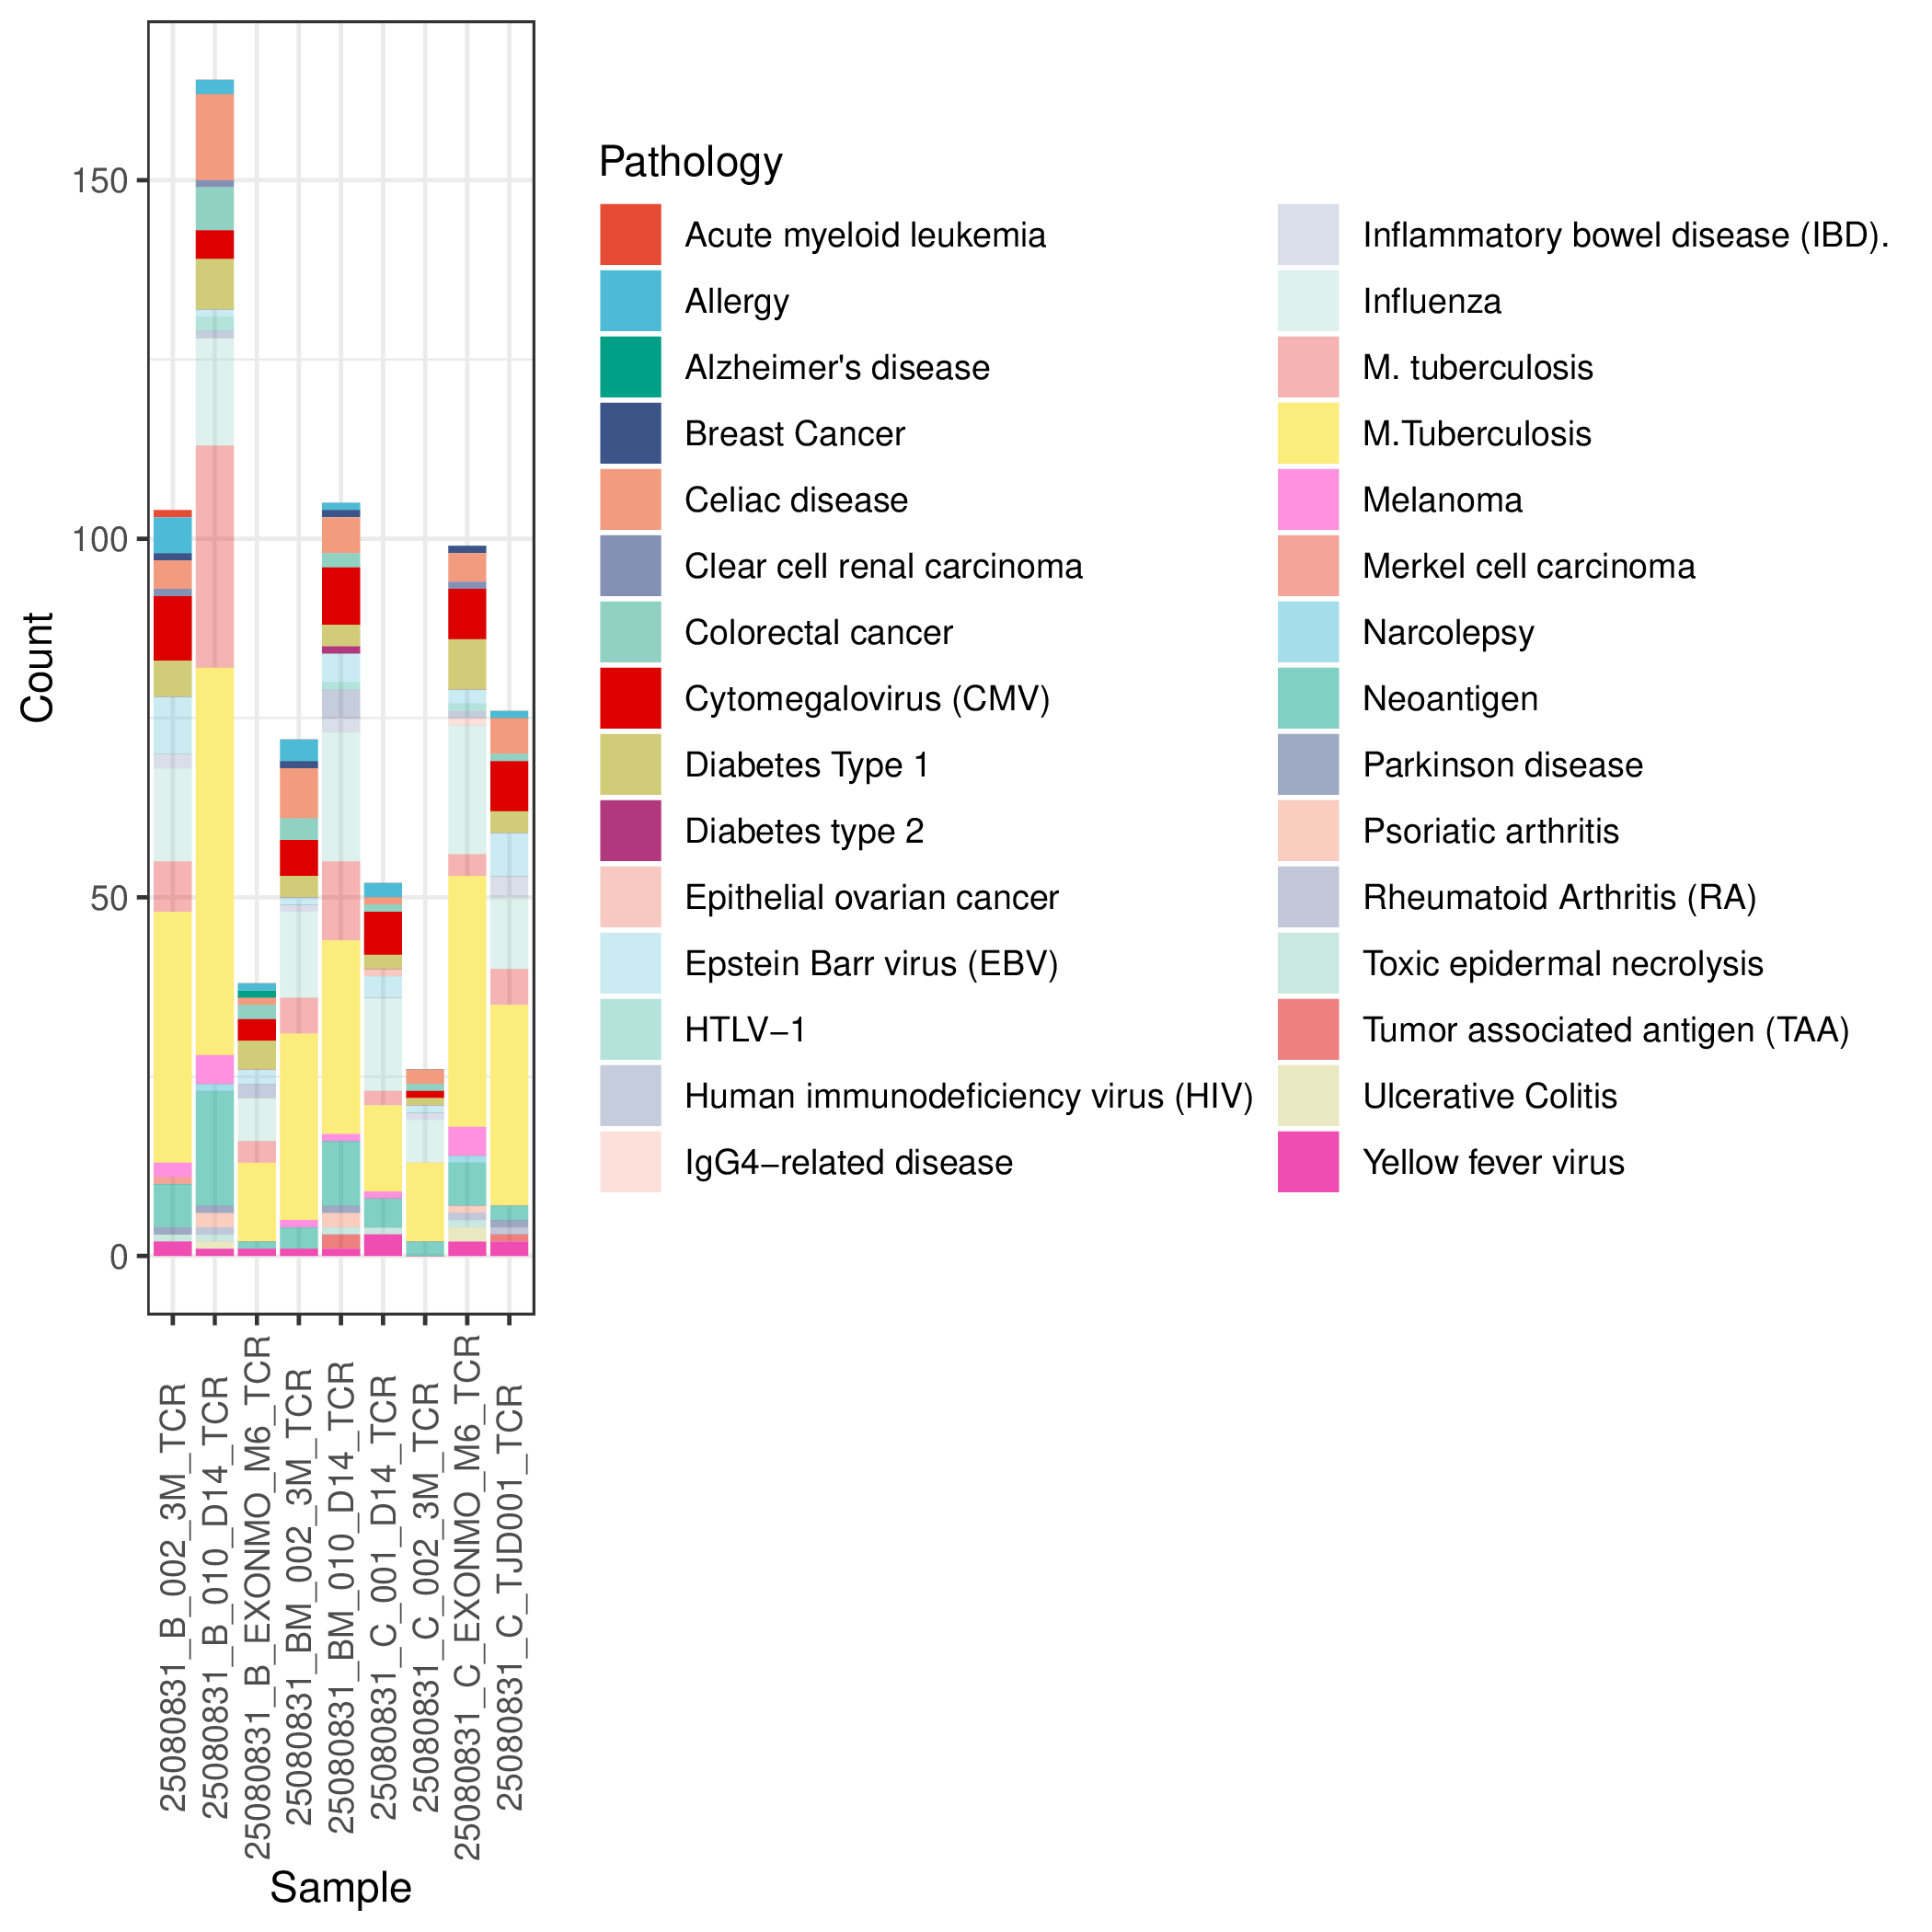
*The figure above shows statistics on the number of pathology-associated TCRs annotated in each sample. The x-axis represents sample names, and the y-axis represents the number of detected pathology-associated TCRs. Different colored bars represent different disease types (such as cancer, viral infections, autoimmune diseases, etc.). This figure provides an intuitive understanding of: (1) which samples are enriched with specific disease-associated TCRs; (2) what types of pathology-associated immune responses are mainly present in the samples; (3) differences in the composition of pathology-associated TCRs between different samples. This information helps understand the immune status of the samples and potential disease associations.
Application Scenarios and Considerations
Application scenarios:
- Tumor immunology analysis: Identify tumor-specific TCRs in tumor-infiltrating lymphocytes (TILs) and assess the strength of anti-tumor immune responses.
- Viral infection research: Detect TCRs associated with specific viruses (such as SARS-CoV-2, EBV, CMV) and assess antiviral immune memory.
- Transplantation immune monitoring: Identify TCRs associated with transplant rejection or graft-versus-host disease (GVHD).
- Immunotherapy monitoring: Track dynamic changes in treatment-related antigen-specific TCRs and assess treatment response.
Considerations:
- TCR annotation results are predictive analyses based on sequence similarity matching and require experimental validation to confirm antigen specificity.
- The high variability of CDR3 sequences means that even similar sequences may recognize different antigen epitopes.
- Database coverage is limited, and many TCR sequences may not find matches, which does not mean they lack biological function.
- Annotation results should be interpreted comprehensively in combination with clinical context, tissue source, and other immunological indicators.
- The same TCR sequence may be reported in different diseases, and the most relevant annotation needs to be selected based on research context.
TIP
Key Points for Result Interpretation:
- Samples enriched with specific disease-associated TCRs may have active immune responses against that disease.
- Detection of virus-associated TCRs may reflect a history of past infection or vaccination rather than current active infection.
- Enrichment of tumor-associated TCRs suggests the presence of anti-tumor immune responses, but further verification of their functional status (effector vs. exhausted) is needed.
- Annotated TCR clonotypes can serve as candidate targets for subsequent functional validation and immunotherapy development.
- Combining with TCR clonal expansion status (see Section 3.11) allows for better assessment of the strength of antigen-specific immune responses.
BCR Somatic Hypermutation Analysis (BCR)
Somatic Hypermutation (SHM) is a key mechanism in B cell maturation that introduces point mutations in immunoglobulin variable region genes, generating antibody variants with different affinities. After selection through affinity maturation, high-affinity antibodies are produced. Analysis of SHM and sequence evolution can reveal B cell maturation status, clonal evolutionary relationships, and antibody affinity maturation processes, providing crucial insights for understanding humoral immune responses and antibody development.
Biological Background
Biological significance of SHM:
- Affinity maturation: In germinal centers (germinal centers of lymph nodes), B cells introduce mutations in the BCR variable region through SHM, producing antibodies with different affinities. B cells with high affinity are selectively expanded, while those with low affinity are eliminated, a process called affinity maturation.
- Immune memory formation: B cells that have undergone SHM and affinity maturation can differentiate into memory B cells or plasma cells, providing long-term humoral immune protection.
- Antibody diversity: SHM greatly increases the diversity of antibody repertoires, enabling the body to respond to mutated pathogens.
- Class switching: SHM often occurs simultaneously with class switch recombination (CSR), where B cells switch from expressing IgM to IgG, IgA, or IgE to adapt to different immune needs.
Biological implications of mutation rates:
- Low mutation rate: Indicates naive B cells or transitional B cells that have not acquired affinity maturation.
- High mutation rate: Indicates sufficient affinity maturation, commonly seen in memory B cells and long-lived plasma cells.
- Abnormally high mutation: May suggest chronic antigen stimulation, autoimmune disease, or B cell malignancies (such as follicular lymphoma).
Mutation Frequency Analysis
Mutation frequency measures the mutation rate of BCR sequences relative to germline reference sequences, typically expressed as a percentage. By comparing BCR sequences with germline V gene reference sequences, the proportion of nucleotide substitutions in the variable region is calculated to infer the maturation status of B cells.
Statistical analysis and comparison of BCR mutation frequencies across different cell populations and samples allows evaluation of the maturation level and functional status of various B cell subsets.
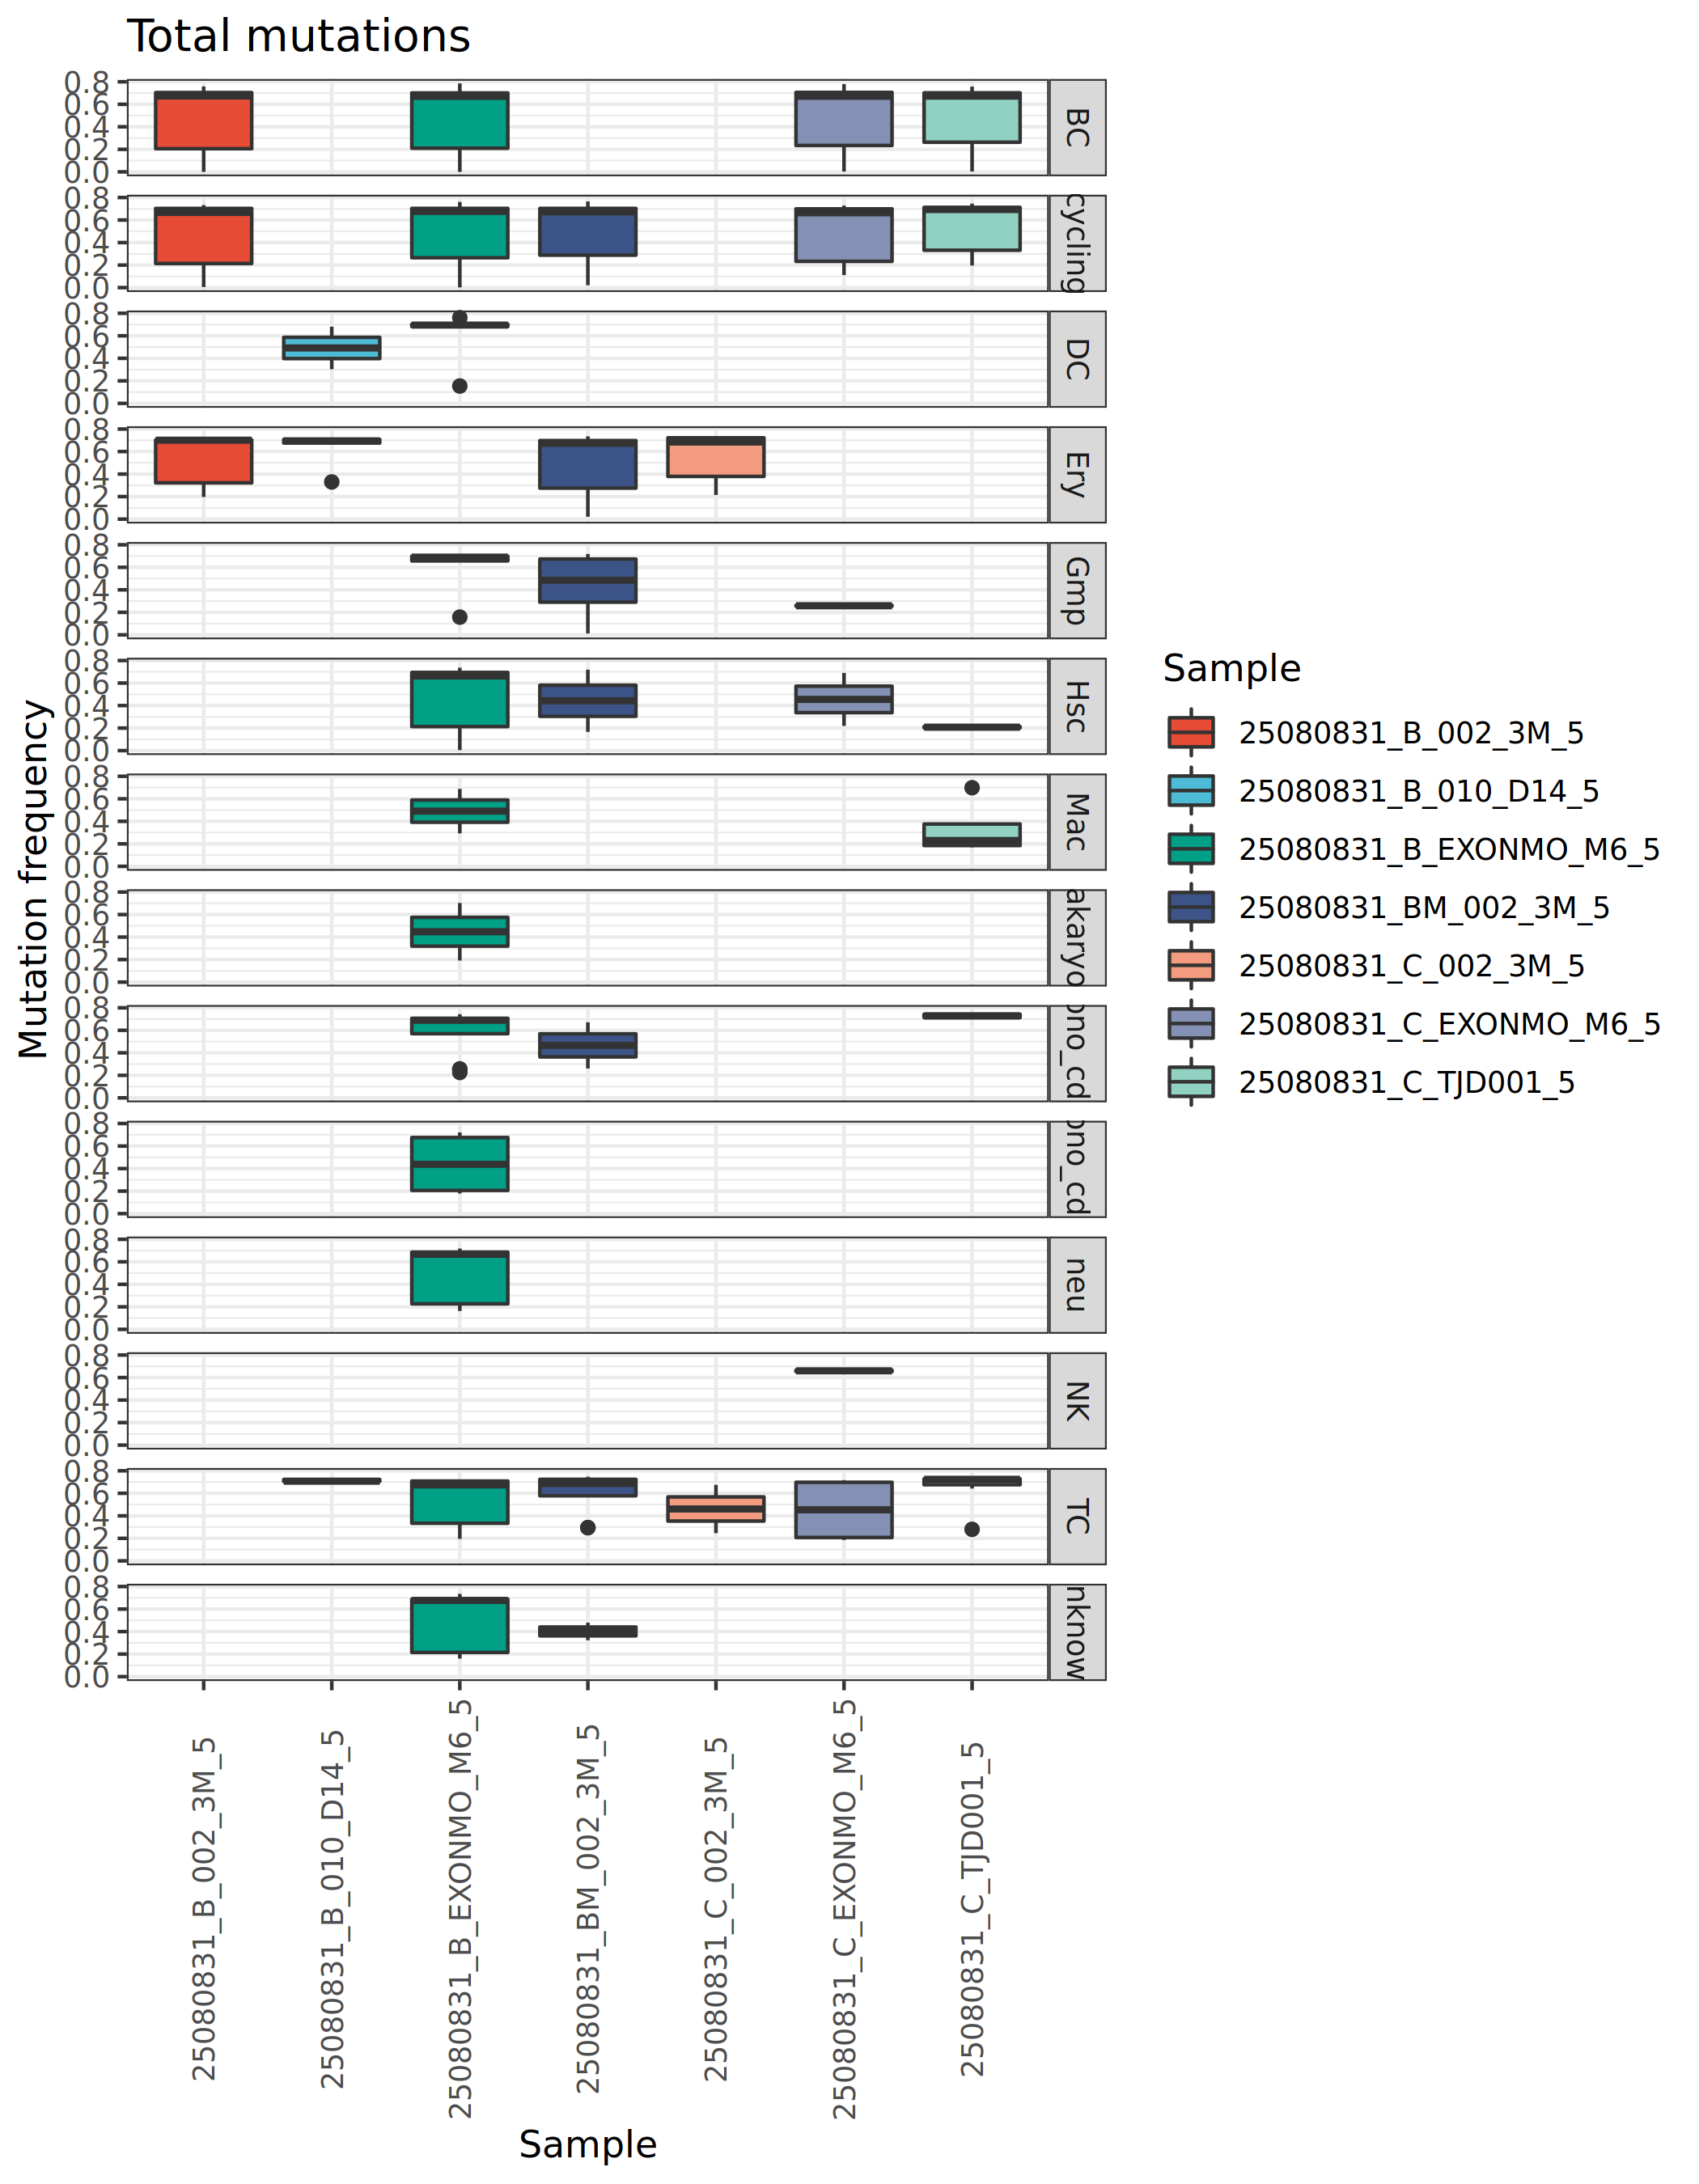
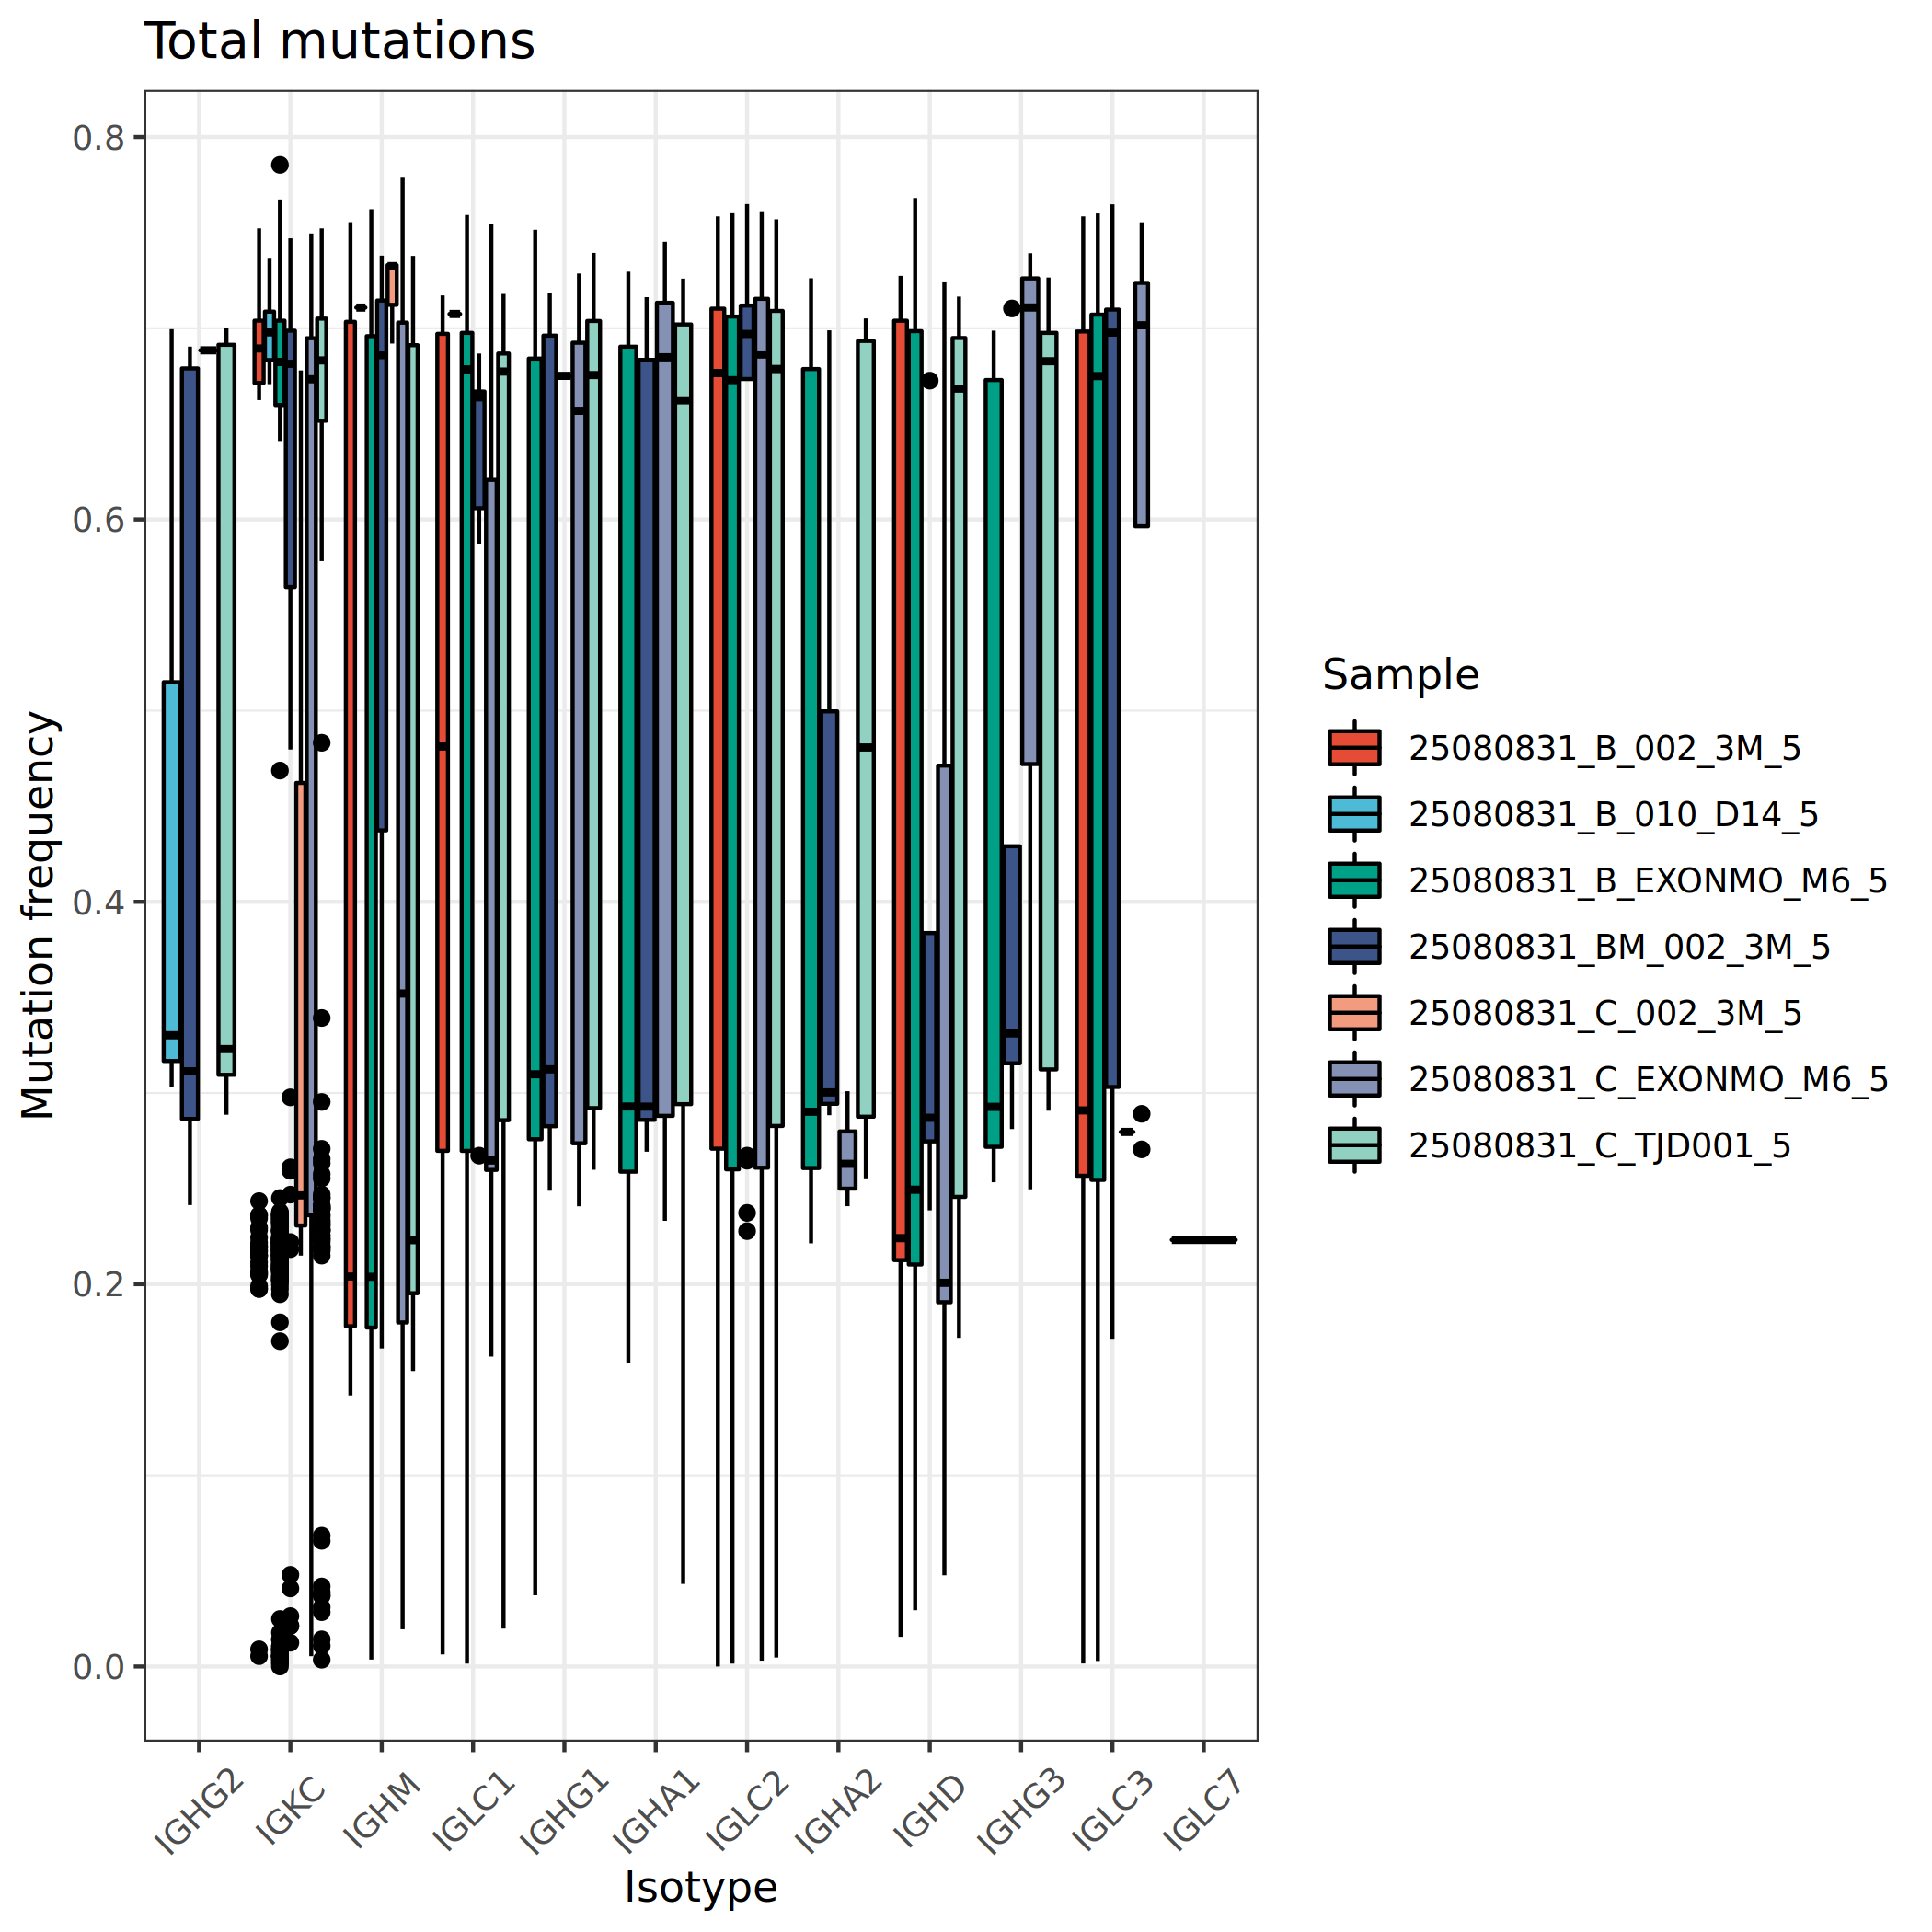
*The figure above shows BCR mutation frequencies in different cell populations and samples. The x-axis represents sample names or immunoglobulin types, and the y-axis represents mutation frequency (percentage). This figure allows observation of: (1) differences in maturation levels among different B cell subsets, such as memory B cells typically having higher mutation rates; (2) mutation characteristics of different immunoglobulin types, such as IgG and IgA usually having higher mutation rates than IgM; (3) differences in B cell maturation status between samples, which may reflect disease status or treatment effects.
Application Scenarios
SHM analysis has significant applications in the following research areas:
- Antibody development research: Tracking the development of broadly neutralizing antibodies to guide rational vaccine design.
- Autoimmune diseases: Investigating the maturation and selection processes of autoreactive B cells.
- Vaccine development: Assessing the quality and maturity of vaccine-induced B cell responses.
- Infectious diseases: Examining the affinity maturation processes of antiviral or antibacterial antibodies.
TIP
Key Points for Result Interpretation:
- High mutation rates usually indicate that B cells have undergone sufficient affinity maturation, commonly seen in memory B cells and plasma cells.
- Differences in mutation rates among different immunoglobulin types reflect further maturation after class switching: IgG/IgA > IgM.
- Mutation clustering in the CDR region may indicate positive selection (affinity maturation), while random distribution may suggest negative selection or neutral drift.
- Combining with clonal expansion analysis (see Section 3.11) and diversity analysis (see Section 3.12) allows for more comprehensive assessment of B cell immune response characteristics.